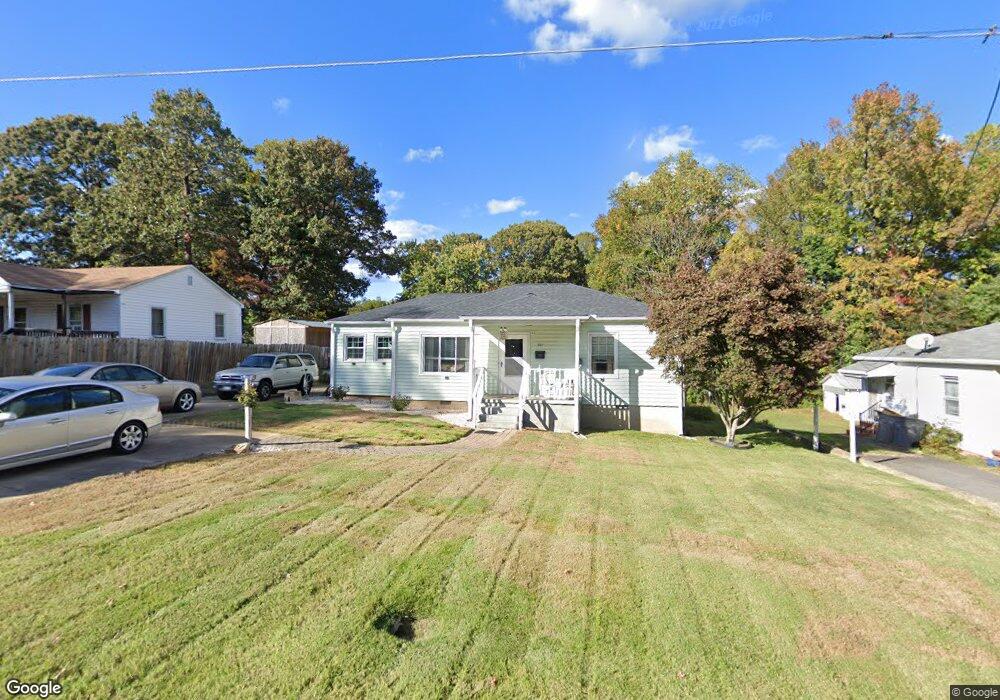
321 E 19th St Kannapolis, NC 28083
Estimated Value: $245,000 - $262,000
3
Beds
2
Baths
1,392
Sq Ft
$181/Sq Ft
Est. Value
About This Home
This home is located at 321 E 19th St, Kannapolis, NC 28083 and is currently estimated at $252,376, approximately $181 per square foot. 321 E 19th St is a home located in Rowan County with nearby schools including North Kannapolis Elementary School, Kannapolis Middle, and A.L. Brown High School.
Ownership History
Date
Name
Owned For
Owner Type
Purchase Details
Closed on
Nov 26, 2012
Sold by
Robinson Charles C and Robinson Prudence A
Bought by
Bruns James F and Bruns Kim K
Current Estimated Value
Home Financials for this Owner
Home Financials are based on the most recent Mortgage that was taken out on this home.
Original Mortgage
$81,987
Outstanding Balance
$57,067
Interest Rate
3.62%
Mortgage Type
FHA
Estimated Equity
$195,309
Purchase Details
Closed on
Jun 6, 2012
Sold by
Rushing Isaac and Rushing Megan
Bought by
Robinson Charles C and Robinson Prudence A
Purchase Details
Closed on
May 20, 2011
Sold by
Robinson Charles C and Robinson Prudence A
Bought by
Rushing Isaac and Rushing Megan
Home Financials for this Owner
Home Financials are based on the most recent Mortgage that was taken out on this home.
Original Mortgage
$88,000
Interest Rate
4.88%
Mortgage Type
Seller Take Back
Create a Home Valuation Report for This Property
The Home Valuation Report is an in-depth analysis detailing your home's value as well as a comparison with similar homes in the area
Home Values in the Area
Average Home Value in this Area
Purchase History
| Date | Buyer | Sale Price | Title Company |
|---|---|---|---|
| Bruns James F | $83,500 | None Available | |
| Robinson Charles C | $93,000 | None Available | |
| Rushing Isaac | $93,000 | None Available |
Source: Public Records
Mortgage History
| Date | Status | Borrower | Loan Amount |
|---|---|---|---|
| Open | Bruns James F | $81,987 | |
| Previous Owner | Rushing Isaac | $88,000 |
Source: Public Records
Tax History
| Year | Tax Paid | Tax Assessment Tax Assessment Total Assessment is a certain percentage of the fair market value that is determined by local assessors to be the total taxable value of land and additions on the property. | Land | Improvement |
|---|---|---|---|---|
| 2025 | $2,297 | $189,817 | $39,645 | $150,172 |
| 2024 | $2,297 | $189,817 | $39,645 | $150,172 |
| 2023 | $2,297 | $189,817 | $39,645 | $150,172 |
| 2022 | $1,358 | $105,458 | $31,064 | $74,394 |
| 2021 | $1,358 | $105,458 | $31,064 | $74,394 |
| 2020 | $1,358 | $105,458 | $31,064 | $74,394 |
| 2019 | $1,358 | $105,458 | $31,064 | $74,394 |
| 2018 | $1,143 | $89,812 | $31,060 | $58,752 |
| 2017 | $1,143 | $89,812 | $31,060 | $58,752 |
| 2016 | $1,143 | $89,812 | $31,060 | $58,752 |
| 2015 | $1,161 | $89,812 | $31,060 | $58,752 |
| 2014 | $1,127 | $90,188 | $28,575 | $61,613 |
Source: Public Records
Map
Nearby Homes
Your Personal Tour Guide
Ask me questions while you tour the home.