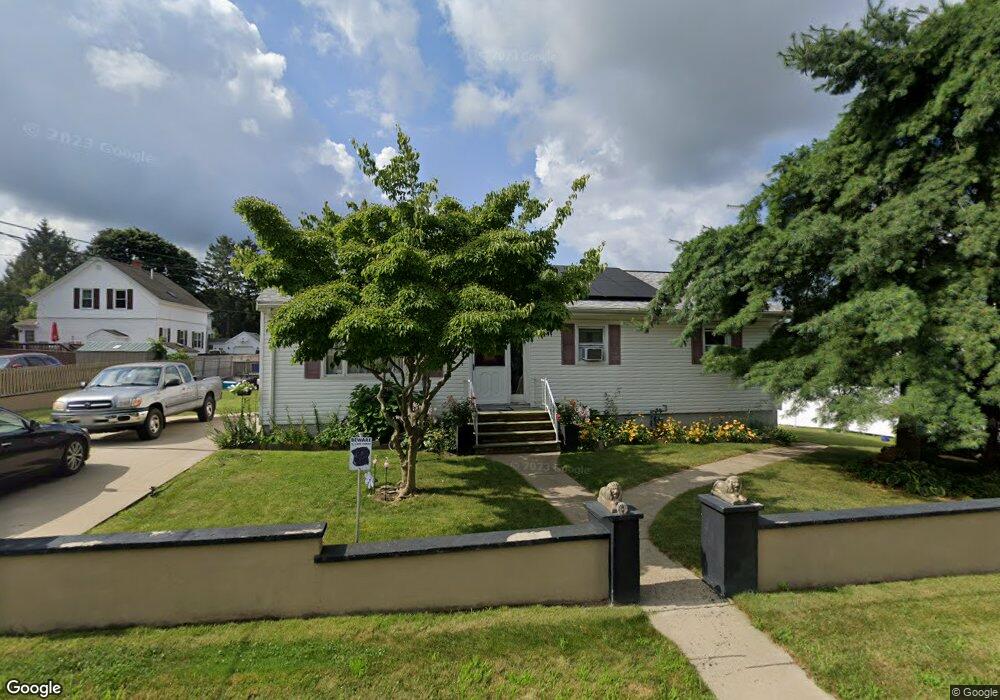
321 Embert St Fall River, MA 02721
Maplewood NeighborhoodEstimated Value: $403,000 - $474,000
3
Beds
2
Baths
1,833
Sq Ft
$234/Sq Ft
Est. Value
About This Home
This home is located at 321 Embert St, Fall River, MA 02721 and is currently estimated at $428,551, approximately $233 per square foot. 321 Embert St is a home located in Bristol County with nearby schools including Letourneau Elementary School, Matthew J. Kuss Middle School, and B M C Durfee High School.
Ownership History
Date
Name
Owned For
Owner Type
Purchase Details
Closed on
Oct 22, 2014
Sold by
Pavao Benilde
Bought by
Pavao Scott R and Pavao Benilde
Current Estimated Value
Purchase Details
Closed on
Oct 28, 2009
Sold by
Pavao Luis M C and Pavao Benilde
Bought by
Pavao Benilde
Create a Home Valuation Report for This Property
The Home Valuation Report is an in-depth analysis detailing your home's value as well as a comparison with similar homes in the area
Home Values in the Area
Average Home Value in this Area
Purchase History
| Date | Buyer | Sale Price | Title Company |
|---|---|---|---|
| Pavao Scott R | -- | -- | |
| Pavao Benilde | -- | -- |
Source: Public Records
Tax History
| Year | Tax Paid | Tax Assessment Tax Assessment Total Assessment is a certain percentage of the fair market value that is determined by local assessors to be the total taxable value of land and additions on the property. | Land | Improvement |
|---|---|---|---|---|
| 2025 | $3,634 | $317,400 | $119,400 | $198,000 |
| 2024 | $3,424 | $298,000 | $117,000 | $181,000 |
| 2023 | $3,345 | $272,600 | $105,400 | $167,200 |
| 2022 | $2,951 | $233,800 | $99,500 | $134,300 |
| 2021 | $2,773 | $200,500 | $95,000 | $105,500 |
| 2020 | $2,672 | $184,900 | $90,700 | $94,200 |
| 2019 | $2,659 | $182,400 | $94,800 | $87,600 |
| 2018 | $2,607 | $178,300 | $95,500 | $82,800 |
| 2017 | $2,475 | $176,800 | $95,500 | $81,300 |
| 2016 | $2,389 | $175,300 | $98,400 | $76,900 |
| 2015 | $2,361 | $180,500 | $98,400 | $82,100 |
| 2014 | $2,271 | $180,500 | $98,400 | $82,100 |
Source: Public Records
Map
Nearby Homes
Your Personal Tour Guide
Ask me questions while you tour the home.