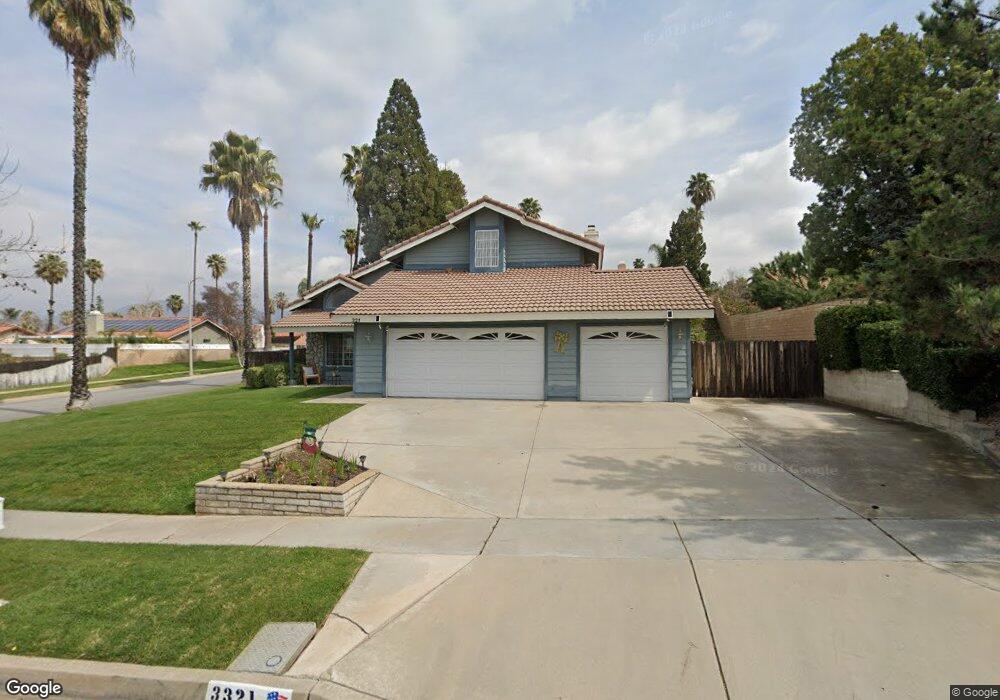
321 Jesse Way Redlands, CA 92374
South Redlands NeighborhoodEstimated Value: $704,419 - $721,000
4
Beds
3
Baths
2,096
Sq Ft
$340/Sq Ft
Est. Value
About This Home
This home is located at 321 Jesse Way, Redlands, CA 92374 and is currently estimated at $712,605, approximately $339 per square foot. 321 Jesse Way is a home located in San Bernardino County with nearby schools including Crafton Elementary School, Moore Middle School, and Redlands East Valley High School.
Ownership History
Date
Name
Owned For
Owner Type
Purchase Details
Closed on
May 15, 2017
Sold by
Drake Larry and Drake Patricia
Bought by
Drake Larry E and Drake Patricia A
Current Estimated Value
Purchase Details
Closed on
Dec 15, 1994
Sold by
Stark Donald E and Stark Gail G
Bought by
Drake Larry and Drake Patricia
Home Financials for this Owner
Home Financials are based on the most recent Mortgage that was taken out on this home.
Original Mortgage
$200,430
Interest Rate
9.2%
Mortgage Type
Assumption
Create a Home Valuation Report for This Property
The Home Valuation Report is an in-depth analysis detailing your home's value as well as a comparison with similar homes in the area
Home Values in the Area
Average Home Value in this Area
Purchase History
| Date | Buyer | Sale Price | Title Company |
|---|---|---|---|
| Drake Larry E | -- | None Available | |
| Drake Larry | $196,500 | Fidelity National Title Ins |
Source: Public Records
Mortgage History
| Date | Status | Borrower | Loan Amount |
|---|---|---|---|
| Closed | Drake Larry | $200,430 |
Source: Public Records
Tax History
| Year | Tax Paid | Tax Assessment Tax Assessment Total Assessment is a certain percentage of the fair market value that is determined by local assessors to be the total taxable value of land and additions on the property. | Land | Improvement |
|---|---|---|---|---|
| 2025 | $1,945 | $329,221 | $75,588 | $253,633 |
| 2024 | $1,843 | $322,766 | $74,106 | $248,660 |
| 2023 | $1,905 | $316,437 | $72,653 | $243,784 |
| 2022 | $1,973 | $310,232 | $71,228 | $239,004 |
| 2021 | $2,003 | $304,149 | $69,831 | $234,318 |
| 2020 | $2,007 | $301,030 | $69,115 | $231,915 |
| 2019 | $1,965 | $295,128 | $67,760 | $227,368 |
| 2018 | $1,941 | $289,341 | $66,431 | $222,910 |
| 2017 | $3,475 | $283,667 | $65,128 | $218,539 |
| 2016 | $3,434 | $278,105 | $63,851 | $214,254 |
| 2015 | $3,408 | $273,928 | $62,892 | $211,036 |
| 2014 | $3,344 | $268,562 | $61,660 | $206,902 |
Source: Public Records
Map
Nearby Homes
- 212 Eastpark Ln
- 1472 Moore St
- 61 Sparrow Ct
- 1665 Wabash Ave
- 1479 Moore St
- 1458 Moore St
- 1452 Moore St
- 1454 E Highland Ave
- 1562 E Citrus Ave
- 1550 Marion Rd
- 1442 Moore St
- 1592 Christopher Ln
- 1410 Pleasantview Dr
- 1575 Christopher Ln
- 15 Naomi St
- 1720 Kingston Cir
- 707 S Wabash Ave
- 705 Hemlock Ct
- 1049 Evergreen Ct
- 626 N Dearborn St Unit 150
- 325 Jesse Way
- 320 Gabrielle Way
- 324 Gabrielle Way
- 313 Jesse Way
- 322 Jesse Way
- 312 Gabrielle Way
- 318 Jesse Way
- 326 Jesse Way
- 329 Jesse Way
- 328 Gabrielle Way
- 314 Jesse Way
- 309 Jesse Way
- 330 Jesse Way
- 319 Gabrielle Way
- 308 Gabrielle Way
- 315 Gabrielle Way
- 323 Gabrielle Way
- 310 Jesse Way
- 313 Silvertree Ln
- 311 Gabrielle Way
Your Personal Tour Guide
Ask me questions while you tour the home.