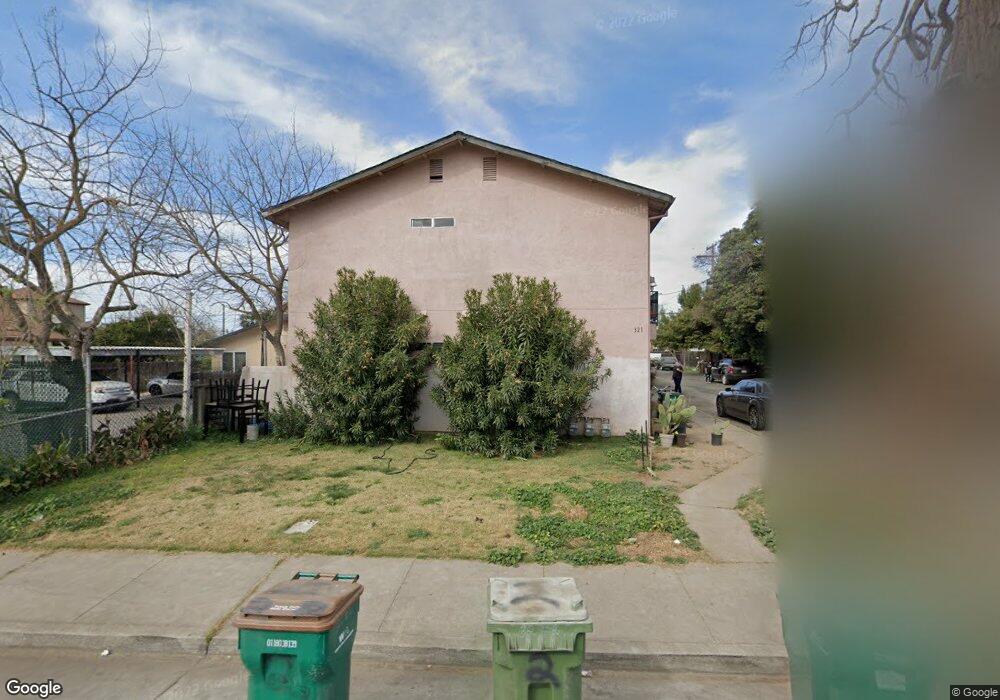
321 Maple St Lodi, CA 95240
Downtown Lodi NeighborhoodEstimated Value: $653,139 - $692,000
8
Beds
4
Baths
3,000
Sq Ft
$224/Sq Ft
Est. Value
About This Home
This home is located at 321 Maple St, Lodi, CA 95240 and is currently estimated at $671,535, approximately $223 per square foot. 321 Maple St is a home located in San Joaquin County with nearby schools including Heritage Elementary School, Lodi Middle School, and Tokay High School.
Ownership History
Date
Name
Owned For
Owner Type
Purchase Details
Closed on
Aug 15, 2016
Sold by
Khan Mohammad and Khan Ishrat
Bought by
Khan Mohammad R and Khan Ishrat B
Current Estimated Value
Purchase Details
Closed on
Sep 22, 2005
Sold by
Hess Beverly and The Beverly Hess Separate Prop
Bought by
Khan Mohammad R and Khan Ishrat B
Home Financials for this Owner
Home Financials are based on the most recent Mortgage that was taken out on this home.
Original Mortgage
$265,000
Outstanding Balance
$140,615
Interest Rate
5.72%
Mortgage Type
Fannie Mae Freddie Mac
Estimated Equity
$530,920
Create a Home Valuation Report for This Property
The Home Valuation Report is an in-depth analysis detailing your home's value as well as a comparison with similar homes in the area
Home Values in the Area
Average Home Value in this Area
Purchase History
| Date | Buyer | Sale Price | Title Company |
|---|---|---|---|
| Khan Mohammad R | -- | None Available | |
| Khan Mohammad R | $511,000 | Placer Title Company |
Source: Public Records
Mortgage History
| Date | Status | Borrower | Loan Amount |
|---|---|---|---|
| Open | Khan Mohammad R | $265,000 |
Source: Public Records
Tax History
| Year | Tax Paid | Tax Assessment Tax Assessment Total Assessment is a certain percentage of the fair market value that is determined by local assessors to be the total taxable value of land and additions on the property. | Land | Improvement |
|---|---|---|---|---|
| 2025 | $7,604 | $698,285 | $278,767 | $419,518 |
| 2024 | $7,397 | $684,594 | $273,301 | $411,293 |
| 2023 | $7,301 | $671,172 | $267,943 | $403,229 |
| 2022 | $7,139 | $658,013 | $262,690 | $395,323 |
| 2021 | $7,268 | $645,112 | $257,540 | $387,572 |
| 2020 | $6,215 | $560,000 | $200,421 | $359,579 |
| 2019 | $5,276 | $475,000 | $170,000 | $305,000 |
| 2018 | $5,305 | $475,000 | $170,000 | $305,000 |
| 2017 | $5,290 | $475,000 | $170,000 | $305,000 |
| 2016 | $4,795 | $450,000 | $115,000 | $335,000 |
| 2014 | $4,303 | $400,000 | $100,000 | $300,000 |
Source: Public Records
Map
Nearby Homes
- 333 Cherry St
- 312 Cherry St
- 834 S Washington St
- 433 Cherry St
- 513 Harold St
- 1000 S Central Ave
- 415 Concord St
- 416 Concord St
- 220 E Lodi Ave
- 517 S Sacramento St
- 325 Cypress St
- 709 S School St
- 7 Chestnut St
- 320 Acacia St
- 914 S Pleasant Ave
- 709 S Lee Ave
- 20075 E Kettleman Ln
- 400 Chestnut St
- 441 Elgin Ave
- 421 E Elm St
Your Personal Tour Guide
Ask me questions while you tour the home.