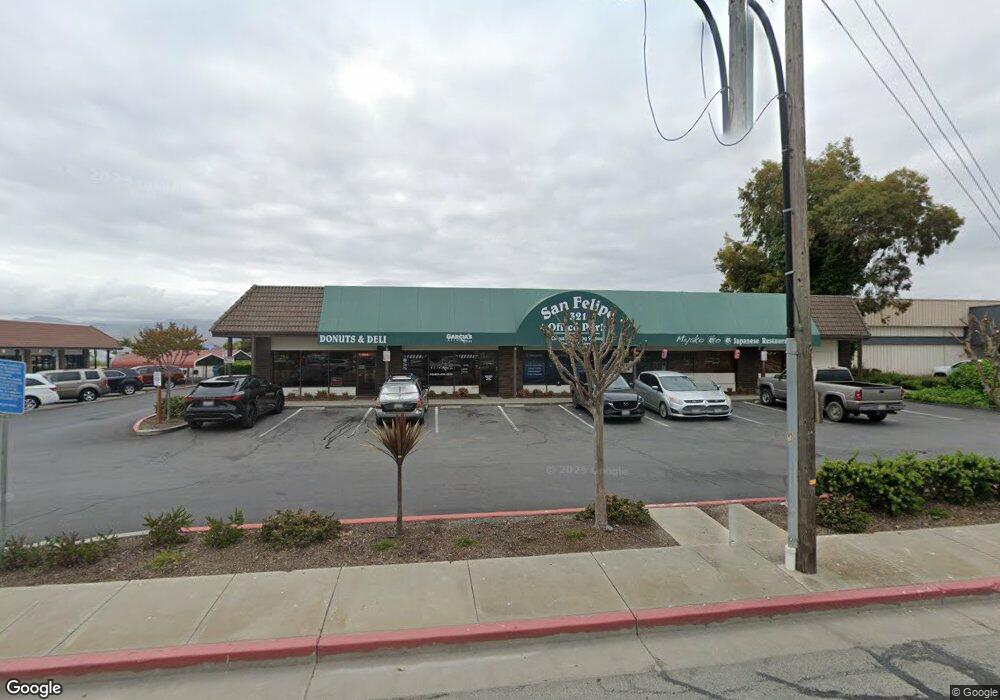
321 San Felipe Rd Unit 5 Hollister, CA 95023
Estimated Value: $218,292
--
Bed
--
Bath
1,138
Sq Ft
$192/Sq Ft
Est. Value
About This Home
This home is located at 321 San Felipe Rd Unit 5, Hollister, CA 95023 and is currently estimated at $218,292, approximately $191 per square foot. 321 San Felipe Rd Unit 5 is a home located in San Benito County with nearby schools including Gabilan Hills School, Maze Middle School, and San Benito High School.
Ownership History
Date
Name
Owned For
Owner Type
Purchase Details
Closed on
Oct 10, 2018
Sold by
Sepideh Sari Beiklou Ashkan and Sepideh Sargordy
Bought by
Asb Investments Llc
Current Estimated Value
Purchase Details
Closed on
Jun 26, 2017
Sold by
Kanaki Shrinivas D and Mulinti Renuka R
Bought by
Sari Beiklou Ashkan and Sargordy Sepideh
Home Financials for this Owner
Home Financials are based on the most recent Mortgage that was taken out on this home.
Original Mortgage
$103,778
Interest Rate
4.02%
Mortgage Type
Commercial
Purchase Details
Closed on
Aug 22, 2012
Sold by
San Felipe Partners Llc
Bought by
Kanaki Shrinivas D
Home Financials for this Owner
Home Financials are based on the most recent Mortgage that was taken out on this home.
Original Mortgage
$172,500
Interest Rate
3.53%
Mortgage Type
Commercial
Create a Home Valuation Report for This Property
The Home Valuation Report is an in-depth analysis detailing your home's value as well as a comparison with similar homes in the area
Home Values in the Area
Average Home Value in this Area
Purchase History
| Date | Buyer | Sale Price | Title Company |
|---|---|---|---|
| Asb Investments Llc | -- | Chicago Title Company | |
| Sari Beiklou Ashkan | $140,000 | Chicago Title Company | |
| Kanaki Shrinivas D | $230,500 | Chicago Title Company |
Source: Public Records
Mortgage History
| Date | Status | Borrower | Loan Amount |
|---|---|---|---|
| Previous Owner | Sari Beiklou Ashkan | $103,778 | |
| Previous Owner | Kanaki Shrinivas D | $172,500 |
Source: Public Records
Tax History Compared to Growth
Tax History
| Year | Tax Paid | Tax Assessment Tax Assessment Total Assessment is a certain percentage of the fair market value that is determined by local assessors to be the total taxable value of land and additions on the property. | Land | Improvement |
|---|---|---|---|---|
| 2025 | $1,990 | $162,475 | $58,026 | $104,449 |
| 2023 | $1,990 | $156,168 | $55,774 | $100,394 |
| 2022 | $1,928 | $153,107 | $54,681 | $98,426 |
| 2021 | $1,903 | $150,106 | $53,609 | $96,497 |
| 2020 | $1,911 | $148,568 | $53,060 | $95,508 |
| 2019 | $1,857 | $145,656 | $52,020 | $93,636 |
| 2018 | $1,813 | $142,800 | $51,000 | $91,800 |
| 2017 | $1,742 | $135,279 | $53,051 | $82,228 |
| 2016 | $1,631 | $132,627 | $52,011 | $80,616 |
| 2015 | $1,616 | $130,636 | $51,230 | $79,406 |
| 2014 | $1,522 | $128,078 | $50,227 | $77,851 |
Source: Public Records
Map
Nearby Homes
- Plan 2862 at Everglen
- Plan 1434 Modeled at Everglen
- Plan 2288 at Everglen
- Plan 1910 Modeled at Everglen
- Plan 2069 at Everglen
- 0 Hwy 25 Unit 21712114
- 230 San Juan Dr
- 331 Summer Morning Dr
- 321 Summer Morning Dr
- 380 Walk About Way
- 401 Walk About Way
- 190 San Benito St
- 773 San Felipe Rd
- 220 4th St
- 400 San Benito St Unit 202
- 400 San Benito St Unit 304
- 400 San Benito St Unit 312
- 400 San Benito St Unit 309
- 400 San Benito St Unit 308
- 400 San Benito St Unit 212
- 321 San Felipe Rd Unit 2
- 321 San Felipe Rd Unit 16
- 321 San Felipe Rd Unit Suite 4
- 321 San Felipe Rd Unit 15
- 321 San Felipe Rd Unit 7
- 321 San Felipe Rd Unit Suite 7
- 321 San Felipe Rd Unit 6
- 321 San Felipe Rd Unit 11
- 321 San Felipe Rd Unit 9
- 321 San Felipe Rd Unit 14
- 321 San Felipe Rd Unit Suite 10
- 321 San Felipe Rd Unit Suite 12
- 321 San Felipe Rd Unit 4
- 321 San Felipe Rd Unit 13
- 321 San Felipe Rd
- 281 San Felipe Rd Unit E
- 281 San Felipe Rd
- 351 San Felipe Rd Unit D
- 351 San Felipe Rd Unit A
- 351 San Felipe Rd Unit 5