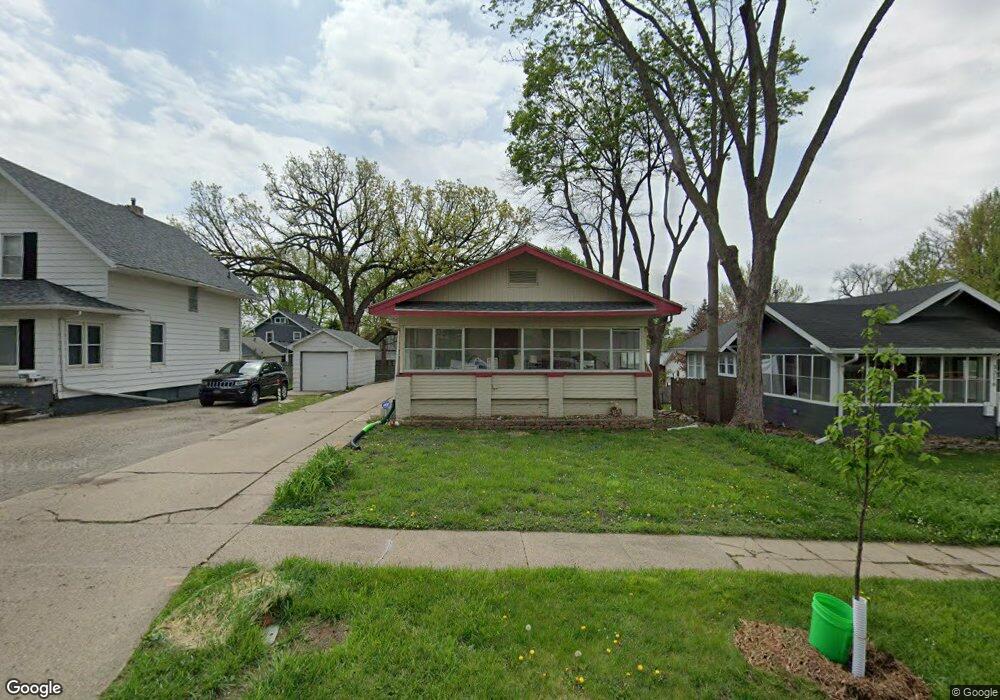
3210 Iola Ave Des Moines, IA 50312
Drake NeighborhoodEstimated Value: $218,000 - $254,000
3
Beds
2
Baths
1,170
Sq Ft
$204/Sq Ft
Est. Value
About This Home
This home is located at 3210 Iola Ave, Des Moines, IA 50312 and is currently estimated at $239,097, approximately $204 per square foot. 3210 Iola Ave is a home located in Polk County with nearby schools including Hubbell Elementary and Roosevelt High School.
Ownership History
Date
Name
Owned For
Owner Type
Purchase Details
Closed on
May 4, 1998
Sold by
Moser Rozsi
Bought by
Driscoll Al
Current Estimated Value
Home Financials for this Owner
Home Financials are based on the most recent Mortgage that was taken out on this home.
Original Mortgage
$57,000
Interest Rate
7.19%
Mortgage Type
Balloon
Create a Home Valuation Report for This Property
The Home Valuation Report is an in-depth analysis detailing your home's value as well as a comparison with similar homes in the area
Home Values in the Area
Average Home Value in this Area
Purchase History
| Date | Buyer | Sale Price | Title Company |
|---|---|---|---|
| Driscoll Al | $37,500 | -- |
Source: Public Records
Mortgage History
| Date | Status | Borrower | Loan Amount |
|---|---|---|---|
| Closed | Driscoll Al | $57,000 |
Source: Public Records
Tax History Compared to Growth
Tax History
| Year | Tax Paid | Tax Assessment Tax Assessment Total Assessment is a certain percentage of the fair market value that is determined by local assessors to be the total taxable value of land and additions on the property. | Land | Improvement |
|---|---|---|---|---|
| 2025 | $4,464 | $249,400 | $49,300 | $200,100 |
| 2024 | $4,464 | $226,900 | $44,600 | $182,300 |
| 2023 | $4,414 | $226,900 | $44,600 | $182,300 |
| 2022 | $4,380 | $187,300 | $39,200 | $148,100 |
| 2021 | $4,188 | $187,300 | $39,200 | $148,100 |
| 2020 | $4,350 | $167,800 | $35,300 | $132,500 |
| 2019 | $3,276 | $167,800 | $35,300 | $132,500 |
| 2018 | $3,242 | $121,900 | $30,700 | $91,200 |
| 2017 | $2,688 | $121,900 | $30,700 | $91,200 |
| 2016 | $2,620 | $99,400 | $27,900 | $71,500 |
| 2015 | $2,620 | $99,400 | $27,900 | $71,500 |
| 2014 | $2,518 | $94,800 | $26,400 | $68,400 |
Source: Public Records
Map
Nearby Homes