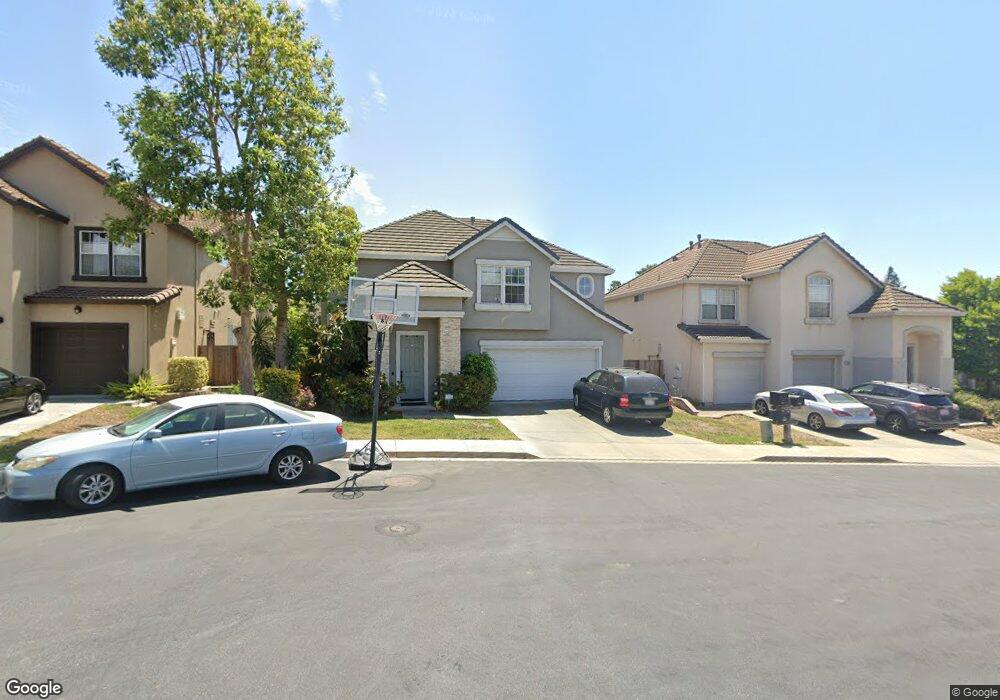
3210 Lakeport Ct San Jose, CA 95148
Murillo NeighborhoodEstimated Value: $1,899,000 - $2,496,000
4
Beds
3
Baths
2,445
Sq Ft
$920/Sq Ft
Est. Value
About This Home
This home is located at 3210 Lakeport Ct, San Jose, CA 95148 and is currently estimated at $2,248,532, approximately $919 per square foot. 3210 Lakeport Ct is a home located in Santa Clara County with nearby schools including Carolyn A. Clark Elementary School, Quimby Oak Middle School, and Evergreen Valley High School.
Ownership History
Date
Name
Owned For
Owner Type
Purchase Details
Closed on
Dec 17, 2007
Sold by
Brennan James R and Brennan Monina Jovita Torres
Bought by
Brennan James Richard and Brennan Monina Jovita Torres
Current Estimated Value
Purchase Details
Closed on
May 8, 2001
Sold by
Brennan James R and Brennan Monina T
Bought by
Brennan James R and Brennan Monina T
Home Financials for this Owner
Home Financials are based on the most recent Mortgage that was taken out on this home.
Original Mortgage
$375,000
Interest Rate
6.87%
Purchase Details
Closed on
Sep 11, 1997
Sold by
Standard Pacific Corp
Bought by
Brennan James R and Torres Monina Jovita O
Home Financials for this Owner
Home Financials are based on the most recent Mortgage that was taken out on this home.
Original Mortgage
$297,000
Interest Rate
7.34%
Create a Home Valuation Report for This Property
The Home Valuation Report is an in-depth analysis detailing your home's value as well as a comparison with similar homes in the area
Home Values in the Area
Average Home Value in this Area
Purchase History
| Date | Buyer | Sale Price | Title Company |
|---|---|---|---|
| Brennan James Richard | -- | None Available | |
| Brennan James R | -- | None Available | |
| Brennan James R | -- | Alliance Title Company | |
| Brennan James R | $372,000 | First American Title Guarant |
Source: Public Records
Mortgage History
| Date | Status | Borrower | Loan Amount |
|---|---|---|---|
| Previous Owner | Brennan James R | $375,000 | |
| Previous Owner | Brennan James R | $297,000 |
Source: Public Records
Tax History Compared to Growth
Tax History
| Year | Tax Paid | Tax Assessment Tax Assessment Total Assessment is a certain percentage of the fair market value that is determined by local assessors to be the total taxable value of land and additions on the property. | Land | Improvement |
|---|---|---|---|---|
| 2025 | $9,716 | $593,491 | $223,534 | $369,957 |
| 2024 | $9,716 | $581,854 | $219,151 | $362,703 |
| 2023 | $9,503 | $570,446 | $214,854 | $355,592 |
| 2022 | $9,412 | $559,262 | $210,642 | $348,620 |
| 2021 | $9,217 | $548,297 | $206,512 | $341,785 |
| 2020 | $8,830 | $542,676 | $204,395 | $338,281 |
| 2019 | $8,596 | $532,037 | $200,388 | $331,649 |
| 2018 | $8,481 | $521,606 | $196,459 | $325,147 |
| 2017 | $8,335 | $511,379 | $192,607 | $318,772 |
| 2016 | $7,959 | $501,353 | $188,831 | $312,522 |
| 2015 | $7,845 | $493,823 | $185,995 | $307,828 |
| 2014 | $7,144 | $484,151 | $182,352 | $301,799 |
Source: Public Records
Map
Nearby Homes
- 3198 Vintage Crest Dr
- 3422 Glenprosen Ct
- 3508 Casabella Ct
- 3430 Maroun Place
- 3114 Pinot Grigio Place
- 3123 Oakgate Way
- 3948 Mosher Dr
- 4121 Horizon Ln
- 4072 Bouquet Park Ln
- 3176 Arcola Ct
- 3145 Chillum Ct
- 3668 Summit Ridge Ct
- 3858 Evangelho Cir
- 4117 Pinot Gris Way
- 0 Quimby Rd Unit 225125081
- 3216 Remington Way
- 4234 Chaboya Rd
- 2847 Norcrest Dr
- 2896 Rathmann Dr
- 2859 Broken Oak Ct
- 3204 Lakeport Ct
- 3216 Lakeport Ct
- 3213 Lakemore Ct
- 3207 Lakemore Ct
- 3923 Lake Ridge Ln
- 3219 Lakemore Ct
- 3217 Lakeport Ct
- 3211 Lakeport Ct
- 3937 Lake Ridge Ln
- 3917 Lake Ridge Ln
- 3931 Lake Ridge Ln
- 3943 Lake Ridge Ln
- 3218 Lakemore Ct
- 3925 Lake Ridge Ln
- 3949 Lake Ridge Ln
- 3955 Lake Ridge Ln
- 3206 Lakemore Ct
- 3919 Lake Ridge Ln
- 3212 Lakemore Ct
- 3961 Lake Ridge Ln