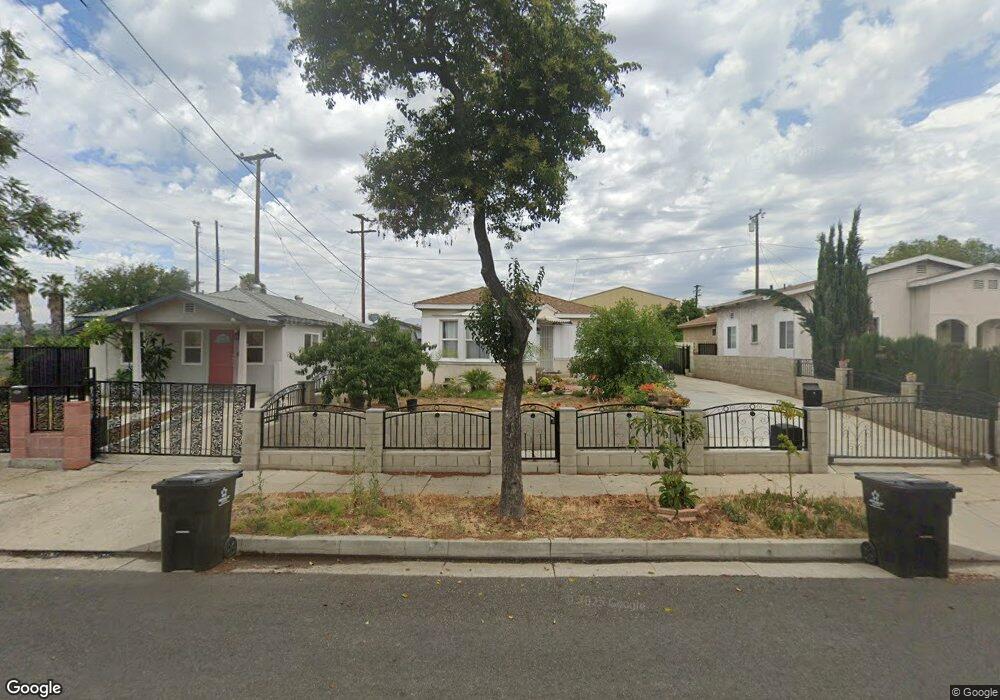
3211 Front St Alhambra, CA 91803
Alhambra Hills NeighborhoodEstimated Value: $800,113 - $931,000
3
Beds
1
Bath
1,173
Sq Ft
$736/Sq Ft
Est. Value
About This Home
This home is located at 3211 Front St, Alhambra, CA 91803 and is currently estimated at $863,278, approximately $735 per square foot. 3211 Front St is a home located in Los Angeles County with nearby schools including Fremont Elementary School, Alhambra High School, and St. Thomas More Catholic Elementary School.
Ownership History
Date
Name
Owned For
Owner Type
Purchase Details
Closed on
Aug 17, 2012
Sold by
Fu Li Ping and Shan Wei Hui
Bought by
Shan Wei Hui and Fu Li Ping
Current Estimated Value
Home Financials for this Owner
Home Financials are based on the most recent Mortgage that was taken out on this home.
Original Mortgage
$283,000
Outstanding Balance
$194,475
Interest Rate
3.5%
Mortgage Type
New Conventional
Estimated Equity
$668,803
Purchase Details
Closed on
Nov 17, 2010
Sold by
Raya Agustin and Raya Baudelia
Bought by
Fu Li Ping and Shan Wei Hui
Home Financials for this Owner
Home Financials are based on the most recent Mortgage that was taken out on this home.
Original Mortgage
$287,900
Interest Rate
4.34%
Mortgage Type
New Conventional
Purchase Details
Closed on
Jun 9, 2010
Sold by
Warne Richard C and The June Isabell Faulk Trust
Bought by
Raya Agustin and Raya Baudelia
Home Financials for this Owner
Home Financials are based on the most recent Mortgage that was taken out on this home.
Original Mortgage
$140,000
Interest Rate
4.76%
Mortgage Type
Purchase Money Mortgage
Create a Home Valuation Report for This Property
The Home Valuation Report is an in-depth analysis detailing your home's value as well as a comparison with similar homes in the area
Home Values in the Area
Average Home Value in this Area
Purchase History
We collect this data history from publicly available records. To have your information removed, we recommend requesting removal directly through your county’s website.
| Date | Buyer | Sale Price | Title Company |
|---|---|---|---|
| Shan Wei Hui | -- | Provident Title Company | |
| Fu Li Ping | $360,000 | North American Title Company | |
| Raya Agustin | $260,000 | North American Title Company |
Source: Public Records
Mortgage History
We collect this data history from publicly available records. To have your information removed, we recommend requesting removal directly through your county’s website.
| Date | Status | Borrower | Loan Amount |
|---|---|---|---|
| Open | Shan Wei Hui | $283,000 | |
| Closed | Fu Li Ping | $287,900 | |
| Previous Owner | Raya Agustin | $140,000 |
Source: Public Records
Tax History
| Year | Tax Paid | Tax Assessment Tax Assessment Total Assessment is a certain percentage of the fair market value that is determined by local assessors to be the total taxable value of land and additions on the property. | Land | Improvement |
|---|---|---|---|---|
| 2025 | $5,690 | $461,084 | $368,846 | $92,238 |
| 2024 | $5,690 | $452,044 | $361,614 | $90,430 |
| 2023 | $5,637 | $443,181 | $354,524 | $88,657 |
| 2022 | $5,370 | $434,492 | $347,573 | $86,919 |
| 2021 | $5,312 | $425,973 | $340,758 | $85,215 |
| 2019 | $5,126 | $413,340 | $330,651 | $82,689 |
| 2018 | $5,084 | $405,236 | $324,168 | $81,068 |
| 2016 | $4,674 | $389,502 | $311,581 | $77,921 |
| 2015 | $4,602 | $383,652 | $306,901 | $76,751 |
| 2014 | $4,544 | $376,138 | $300,890 | $75,248 |
Source: Public Records
Map
Nearby Homes
- 1324 Milton Ave
- 1405 Westminster Ave
- 1607 Westmont Dr
- 2925 W Shorb St
- 5349 Allan St
- 2334 Highbury Ave
- 2345 Highbury Ave Unit 22
- 2324 Lillyvale Ave Unit 143
- 5371 Alhambra Ave
- 2916 Vaquero Ave
- 5360 Ithaca Ave
- 1705 S Fremont Ave
- 2616 Haven St
- 5306 Borland Rd
- 2917 W Hellman Ave
- 1608 Elm St
- 5274 Ithaca Ave
- 2600 Adkins Ave
- 2849 Adkins Ave
- 2818 Adkins Ave
- 3205 Front St
- 3215 Front St
- 3201 Front St
- 3371 Front St
- 3165 Front St
- 1301 Westmont Dr
- 3161 Front St
- 1305 Westmont Dr
- 3157 Front St
- 1309 Westmont Dr
- 1300 Westmont Dr
- 3153 Front St
- 1304 Westmont Dr
- 1315 Westmont Dr
- 1310 Westmont Dr
- 3149 Front St
- 1317 Westmont Dr
- 1312 Westmont Dr
- 3128 Front St
- 3145 Front St
Your Personal Tour Guide
Ask me questions while you tour the home.