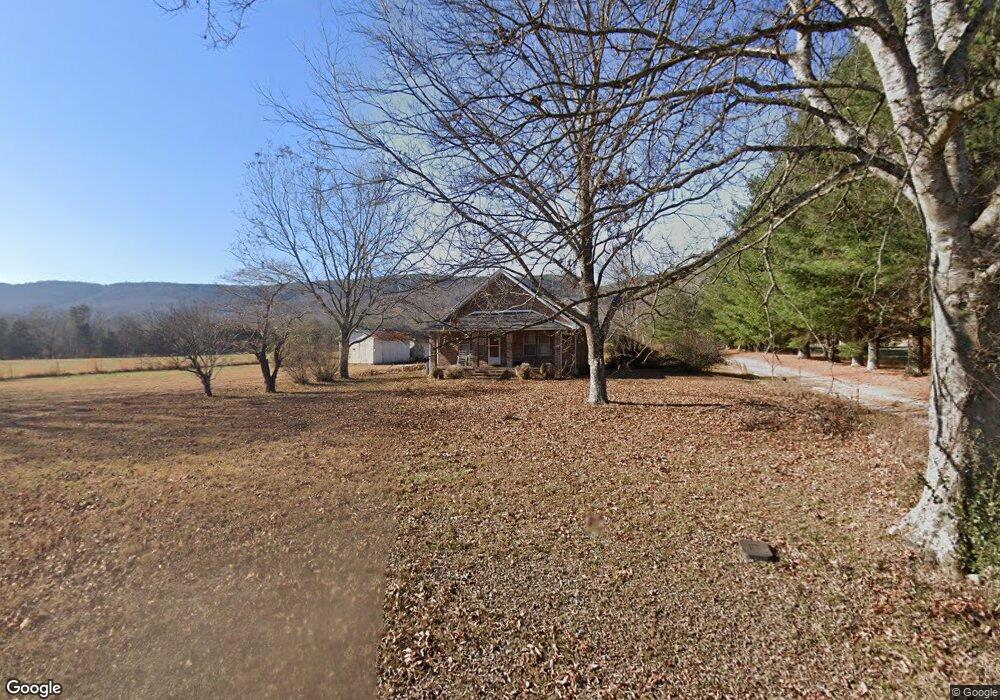
3211 Old State Highway 28 Dunlap, TN 37327
Estimated Value: $206,000 - $612,019
2
Beds
1
Bath
1,000
Sq Ft
$413/Sq Ft
Est. Value
About This Home
This home is located at 3211 Old State Highway 28, Dunlap, TN 37327 and is currently estimated at $412,505, approximately $412 per square foot. 3211 Old State Highway 28 is a home located in Bledsoe County with nearby schools including Bledsoe County High School.
Ownership History
Date
Name
Owned For
Owner Type
Purchase Details
Closed on
Aug 30, 2024
Sold by
Boring Michael L and Boring Marina C
Bought by
Fields At Fall Creek
Current Estimated Value
Purchase Details
Closed on
Aug 29, 2024
Sold by
Heard James Franklin
Bought by
Boring Michael L and Boring Marina C
Purchase Details
Closed on
Jun 19, 2024
Sold by
Brackett Charles Paul
Bought by
Boring Michael L and Boring Marina C
Purchase Details
Closed on
May 21, 2024
Sold by
Guerrini Lisa Evalina and Guerrini Harley Ormano
Bought by
Boring Michael L and Boring Marina C
Purchase Details
Closed on
Jan 2, 2024
Sold by
Brackett Rogers Tammy
Bought by
Boring Michael L and Boring Marina C
Purchase Details
Closed on
Nov 10, 2023
Sold by
Russell Viola Elizabeth
Bought by
Boring Michael L and Boring Marina C
Create a Home Valuation Report for This Property
The Home Valuation Report is an in-depth analysis detailing your home's value as well as a comparison with similar homes in the area
Home Values in the Area
Average Home Value in this Area
Purchase History
| Date | Buyer | Sale Price | Title Company |
|---|---|---|---|
| Fields At Fall Creek | $600,000 | Looney & Chadwell Title | |
| Boring Michael L | -- | None Listed On Document | |
| Boring Michael L | -- | None Listed On Document | |
| Boring Michael L | -- | None Listed On Document | |
| Boring Michael L | -- | None Listed On Document | |
| Boring Michael L | -- | None Listed On Document |
Source: Public Records
Tax History Compared to Growth
Tax History
| Year | Tax Paid | Tax Assessment Tax Assessment Total Assessment is a certain percentage of the fair market value that is determined by local assessors to be the total taxable value of land and additions on the property. | Land | Improvement |
|---|---|---|---|---|
| 2025 | $305 | $14,775 | $0 | $0 |
| 2024 | $305 | $14,775 | $3,250 | $11,525 |
| 2023 | $305 | $14,775 | $3,250 | $11,525 |
| 2022 | $277 | $14,775 | $3,250 | $11,525 |
| 2021 | $261 | $10,925 | $3,000 | $7,925 |
| 2020 | $261 | $10,925 | $3,000 | $7,925 |
| 2019 | $261 | $10,925 | $3,000 | $7,925 |
| 2018 | $241 | $10,925 | $3,000 | $7,925 |
| 2017 | $241 | $10,925 | $3,000 | $7,925 |
| 2016 | $254 | $11,225 | $3,150 | $8,075 |
| 2015 | $249 | $11,225 | $3,150 | $8,075 |
| 2014 | $249 | $11,225 | $3,150 | $8,075 |
Source: Public Records
Map
Nearby Homes
- 18 Old State Highway 28
- 280 Chapman Rd
- 25066 US 127
- 459 Pope Rd
- 3 Lusk Loop Rd
- 37 Golden St
- 0 Old State Highway 28
- 91 Lightning Ln
- 91 Hidden View Dr
- 500 Old Highway 28
- 442 Billingsley Rd
- 16 Old State Hwy 28
- 2604 Lower East Valley Rd
- 19 Lower Brow Rd
- 515 Old Us Highway 28
- 1 Old Highway 28
- 844 Big Cedar Dr
- 0 Bill Pope Dr
- 30 Big Cedar Dr
- 76 Big Cedar Dr
- 3229 Old State Highway 28
- 3000 Old State Highway 28
- 24730 Us 127
- 2941 Old State Highway 28
- 000 State Highway 127
- 24406 Us 127
- 24748 Us 127
- 2815 Old State Highway 28
- 24892 Us Hwy 127
- 24892 Us 127
- 598 Chapman Rd
- 25000 Us 127
- 24238 Us 127
- 25002 Us 127
- 2653 Old State Highway 28
- 86 Songer Ln
- 227 Chapman Rd
- 24039 Us 127
- 209 Chapman Rd
- 124 Songer Ln