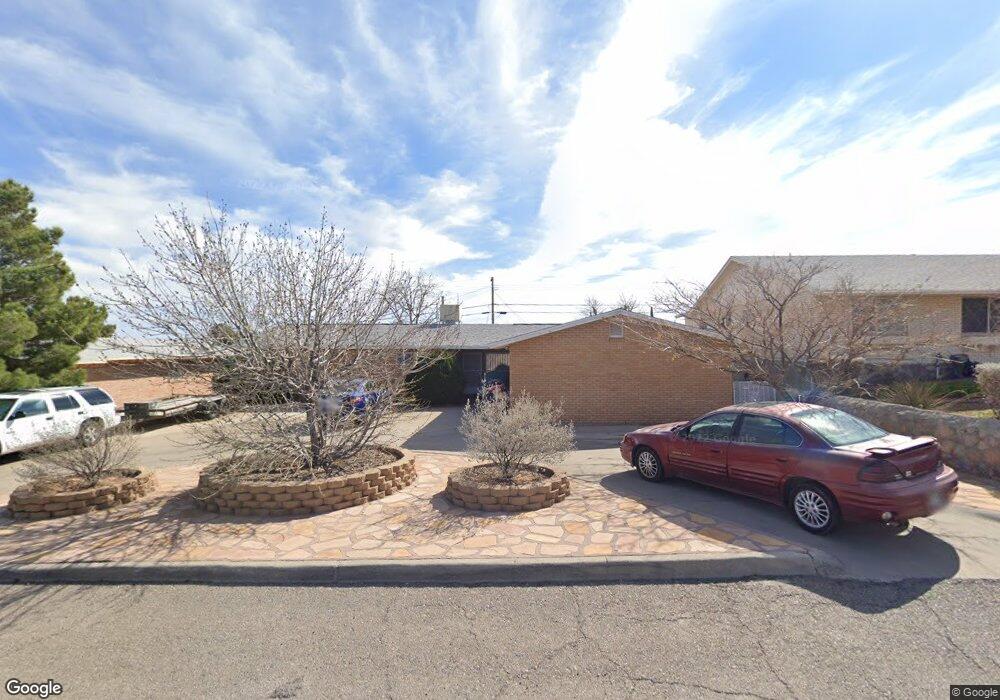
3212 Pierce Ave El Paso, TX 79930
Central NeighborhoodEstimated Value: $227,313 - $263,000
3
Beds
2
Baths
1,720
Sq Ft
$143/Sq Ft
Est. Value
About This Home
This home is located at 3212 Pierce Ave, El Paso, TX 79930 and is currently estimated at $246,578, approximately $143 per square foot. 3212 Pierce Ave is a home located in El Paso County with nearby schools including Clendenin Elementary School, Middle School-5 NW Middle, and Austin High School.
Ownership History
Date
Name
Owned For
Owner Type
Purchase Details
Closed on
Nov 29, 2010
Sold by
Espinosa Gloria J and Rosales Lilia
Bought by
Melendez Maria D
Current Estimated Value
Home Financials for this Owner
Home Financials are based on the most recent Mortgage that was taken out on this home.
Original Mortgage
$76,406
Outstanding Balance
$1,729
Interest Rate
4.4%
Mortgage Type
FHA
Estimated Equity
$244,849
Purchase Details
Closed on
Feb 13, 2003
Sold by
Espinoza Ernesto
Bought by
Espinosa Gloria J and Rosales Lilia
Home Financials for this Owner
Home Financials are based on the most recent Mortgage that was taken out on this home.
Original Mortgage
$91,670
Interest Rate
5.84%
Purchase Details
Closed on
Nov 19, 1997
Sold by
Thorne Janis N and Newman Margaret A
Bought by
Espinoza Ernesto and Espinoza Sonia
Home Financials for this Owner
Home Financials are based on the most recent Mortgage that was taken out on this home.
Original Mortgage
$79,908
Interest Rate
7.23%
Mortgage Type
FHA
Create a Home Valuation Report for This Property
The Home Valuation Report is an in-depth analysis detailing your home's value as well as a comparison with similar homes in the area
Home Values in the Area
Average Home Value in this Area
Purchase History
| Date | Buyer | Sale Price | Title Company |
|---|---|---|---|
| Melendez Maria D | -- | None Available | |
| Espinosa Gloria J | -- | -- | |
| Espinoza Ernesto | -- | -- |
Source: Public Records
Mortgage History
| Date | Status | Borrower | Loan Amount |
|---|---|---|---|
| Open | Melendez Maria D | $76,406 | |
| Previous Owner | Espinosa Gloria J | $91,670 | |
| Previous Owner | Espinoza Ernesto | $79,908 |
Source: Public Records
Tax History Compared to Growth
Tax History
| Year | Tax Paid | Tax Assessment Tax Assessment Total Assessment is a certain percentage of the fair market value that is determined by local assessors to be the total taxable value of land and additions on the property. | Land | Improvement |
|---|---|---|---|---|
| 2025 | $3,312 | $219,332 | -- | -- |
| 2024 | $3,312 | $199,393 | -- | -- |
| 2023 | $3,248 | $181,266 | $0 | $0 |
| 2022 | $4,878 | $164,787 | $0 | $0 |
| 2021 | $4,677 | $149,806 | $25,764 | $124,042 |
| 2020 | $4,619 | $150,284 | $20,059 | $130,225 |
| 2018 | $4,308 | $145,556 | $20,059 | $125,497 |
| 2017 | $3,931 | $139,564 | $20,059 | $119,505 |
| 2016 | $3,931 | $139,564 | $20,059 | $119,505 |
| 2015 | $3,596 | $139,564 | $20,059 | $119,505 |
| 2014 | $3,596 | $140,304 | $20,059 | $120,245 |
Source: Public Records
Map
Nearby Homes
- 3312 Polk Ave
- 3010 Pierce Ave
- 3501 Taylor Ave
- 3501 Polk Ave
- 3104 Van Buren Ave
- 3021 Monroe Ave
- 2801 Polk Ave
- 3413 Monroe Ave
- 2704 Taylor Ave
- 3904 N Piedras St Unit A-B
- 3808 Johnson Ave
- 3906 Taylor Ave
- 3905 Monroe Ave
- 3704 Mckinley Ave
- 3737 Fred Wilson Ave
- 3027 Morehead Ave
- 3423 Wickham Ave
- 4029 Lincoln Ave
- 3031 Fort Blvd
- 3901 Mckinley Ave
- 3220 Pierce Ave
- 3206 Pierce Ave
- 3215 Fillmore Ave
- 3200 Pierce Ave
- 3300 Pierce Ave
- 3211 Fillmore Ave
- 3116 Pierce Ave
- 3301 Fillmore Ave
- 3304 Pierce Ave
- 3301 Pierce Ave
- 3117 Fillmore Ave
- 3112 Pierce Ave
- 3305 Fillmore Ave
- 3308 Pierce Ave
- 3305 Pierce Ave
- 3210 Fillmore Ave
- 3210 Fillmore Ave Unit 1
- 3220 Fillmore Ave
- 3309 Pierce Ave
- 3309 Pierce Ave