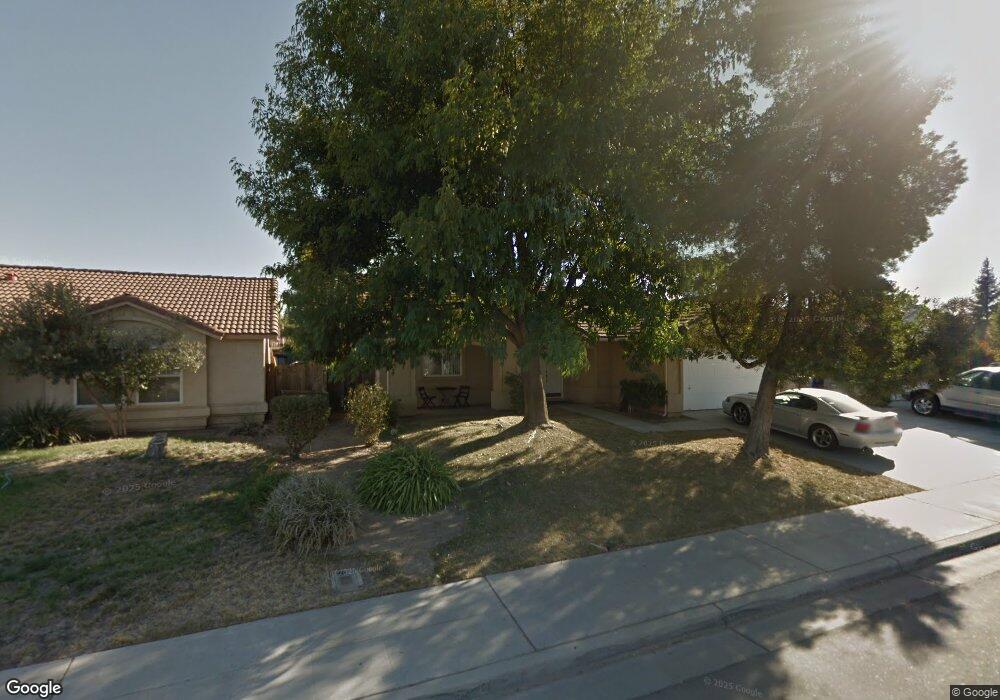
3212 Summer Ln Madera, CA 93637
West Madera NeighborhoodEstimated Value: $367,223 - $392,000
3
Beds
2
Baths
1,453
Sq Ft
$263/Sq Ft
Est. Value
About This Home
This home is located at 3212 Summer Ln, Madera, CA 93637 and is currently estimated at $382,056, approximately $262 per square foot. 3212 Summer Ln is a home located in Madera County with nearby schools including Howard Elementary School, Madera High School, and St. Joachim Elementary School.
Ownership History
Date
Name
Owned For
Owner Type
Purchase Details
Closed on
Sep 1, 2009
Sold by
Griffin Trudy J and The Trudy J Griffin Family Tru
Bought by
Roberts Richard D and Roberts Carmen M
Current Estimated Value
Purchase Details
Closed on
Apr 4, 2005
Sold by
Griffin Trudy J
Bought by
Griffin Trudy J and The Trudy J Griffin Family Tru
Home Financials for this Owner
Home Financials are based on the most recent Mortgage that was taken out on this home.
Original Mortgage
$140,000
Interest Rate
5.61%
Mortgage Type
Purchase Money Mortgage
Purchase Details
Closed on
Feb 22, 2005
Sold by
Belt Brandon
Bought by
Griffin Trudy
Home Financials for this Owner
Home Financials are based on the most recent Mortgage that was taken out on this home.
Original Mortgage
$140,000
Interest Rate
5.61%
Mortgage Type
Purchase Money Mortgage
Purchase Details
Closed on
Jul 9, 2002
Sold by
Villa St Claire Llc
Bought by
Belt Brandon
Home Financials for this Owner
Home Financials are based on the most recent Mortgage that was taken out on this home.
Original Mortgage
$131,965
Interest Rate
6.09%
Mortgage Type
FHA
Create a Home Valuation Report for This Property
The Home Valuation Report is an in-depth analysis detailing your home's value as well as a comparison with similar homes in the area
Home Values in the Area
Average Home Value in this Area
Purchase History
| Date | Buyer | Sale Price | Title Company |
|---|---|---|---|
| Roberts Richard D | $139,000 | Chicago Title Company | |
| Griffin Trudy J | -- | -- | |
| Griffin Trudy | $285,000 | -- | |
| Belt Brandon | $134,000 | Chicago Title |
Source: Public Records
Mortgage History
| Date | Status | Borrower | Loan Amount |
|---|---|---|---|
| Previous Owner | Griffin Trudy | $140,000 | |
| Previous Owner | Belt Brandon | $131,965 |
Source: Public Records
Tax History
| Year | Tax Paid | Tax Assessment Tax Assessment Total Assessment is a certain percentage of the fair market value that is determined by local assessors to be the total taxable value of land and additions on the property. | Land | Improvement |
|---|---|---|---|---|
| 2025 | $2,187 | $180,222 | $77,793 | $102,429 |
| 2023 | $2,187 | $173,225 | $74,773 | $98,452 |
| 2022 | $2,050 | $169,829 | $73,307 | $96,522 |
| 2021 | $2,014 | $166,500 | $71,870 | $94,630 |
| 2020 | $2,049 | $164,794 | $71,134 | $93,660 |
| 2019 | $2,034 | $161,564 | $69,740 | $91,824 |
| 2018 | $1,884 | $158,397 | $68,373 | $90,024 |
| 2017 | $1,863 | $155,292 | $67,033 | $88,259 |
| 2016 | $1,838 | $152,248 | $65,719 | $86,529 |
| 2015 | $1,809 | $149,962 | $64,732 | $85,230 |
| 2014 | $1,593 | $147,025 | $63,464 | $83,561 |
Source: Public Records
Map
Nearby Homes
- 3124 Summer Ln
- 418 S Creek Dr
- 242 Makenna Dr
- 125 Queen Ln
- 99 Rosewood Cir
- 294 Double Tree Ct
- 11 Seasons Ct
- 3147 Boulder Ave
- 3108 Capistrano Dr
- 125 S Granada Dr Unit 42
- 3140 Capistrano Dr
- 14183 Road 24
- 3803 Via Santa Barbara
- 908 Suburban Ave
- 2428 W 3rd St
- 3808 Via Capitola
- 402 Mainberry Dr
- 3215 Tragon St
- 1201 Via Valencia Dr
- 1225 Via Valencia Dr
- 3198 Summer Ln
- 3230 Summer Ln
- 3211 Winter Way
- 3178 Summer Ln
- 3193 Winter Way
- 3227 Winter Way
- 3177 Winter Way
- 3211 Summer Ln
- 3160 Summer Ln
- 3229 Summer Ln
- 3193 Summer Ln
- 302 Timberline Dr
- 3161 Winter Way
- 320 Timberline Dr
- 3175 Summer Ln
- 276 Timberline Dr
- 3144 Summer Ln
- 334 Timberline Dr
- 262 Timberline Dr
- 3155 Summer Ln
Your Personal Tour Guide
Ask me questions while you tour the home.