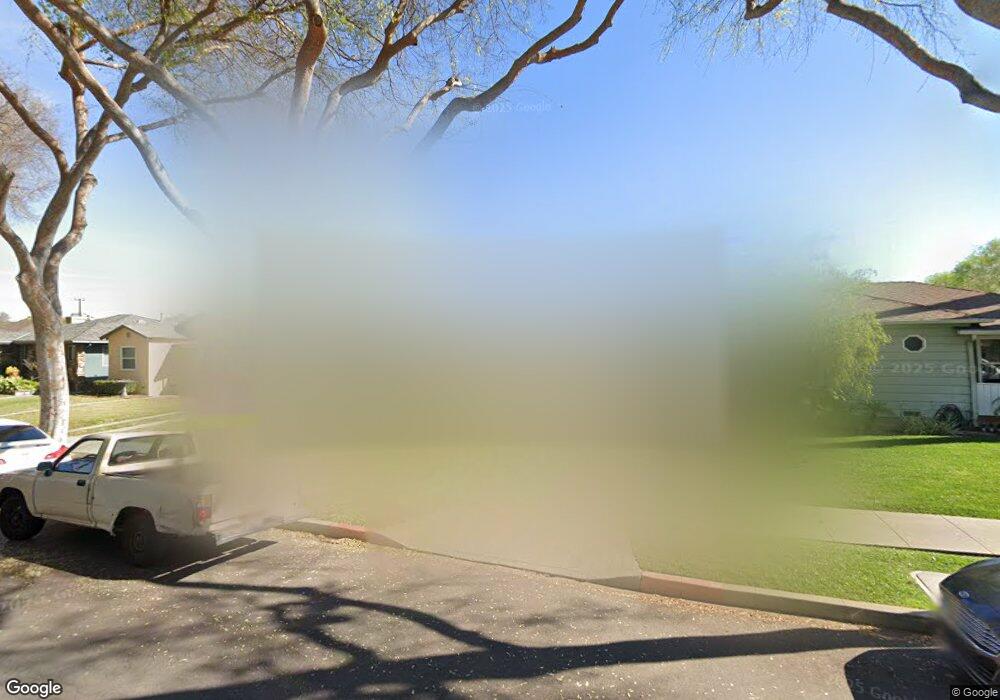
3218 Lemon Ave Signal Hill, CA 90755
Estimated Value: $850,384 - $908,000
3
Beds
1
Bath
1,320
Sq Ft
$676/Sq Ft
Est. Value
About This Home
This home is located at 3218 Lemon Ave, Signal Hill, CA 90755 and is currently estimated at $891,846, approximately $675 per square foot. 3218 Lemon Ave is a home located in Los Angeles County with nearby schools including Signal Hill Elementary School, Hughes Middle School, and Long Beach Polytechnic High School.
Ownership History
Date
Name
Owned For
Owner Type
Purchase Details
Closed on
Jan 11, 2010
Sold by
Kennerson David R
Bought by
Kennerson David R and Kennerson Silvia O
Current Estimated Value
Purchase Details
Closed on
Feb 21, 1997
Sold by
Thomas James
Bought by
Kennerson David and Kennerson Silvia O
Home Financials for this Owner
Home Financials are based on the most recent Mortgage that was taken out on this home.
Original Mortgage
$107,200
Interest Rate
7.63%
Purchase Details
Closed on
Aug 5, 1994
Sold by
Thomas Elizabeth Irene
Bought by
Thomas James
Purchase Details
Closed on
Jan 12, 1994
Sold by
Sunstedt Cynthia L
Bought by
Thomas James
Home Financials for this Owner
Home Financials are based on the most recent Mortgage that was taken out on this home.
Original Mortgage
$120,000
Interest Rate
8.57%
Create a Home Valuation Report for This Property
The Home Valuation Report is an in-depth analysis detailing your home's value as well as a comparison with similar homes in the area
Home Values in the Area
Average Home Value in this Area
Purchase History
| Date | Buyer | Sale Price | Title Company |
|---|---|---|---|
| Kennerson David R | -- | None Available | |
| Kennerson David | $134,000 | Benefit Land Title Company | |
| Thomas James | -- | First American Title Co | |
| Thomas James | $150,000 | First American Title Co |
Source: Public Records
Mortgage History
| Date | Status | Borrower | Loan Amount |
|---|---|---|---|
| Previous Owner | Kennerson David | $107,200 | |
| Previous Owner | Thomas James | $120,000 | |
| Closed | Kennerson David | $23,500 |
Source: Public Records
Tax History Compared to Growth
Tax History
| Year | Tax Paid | Tax Assessment Tax Assessment Total Assessment is a certain percentage of the fair market value that is determined by local assessors to be the total taxable value of land and additions on the property. | Land | Improvement |
|---|---|---|---|---|
| 2025 | $3,952 | $267,872 | $174,582 | $93,290 |
| 2024 | $3,952 | $262,620 | $171,159 | $91,461 |
| 2023 | $3,889 | $257,471 | $167,803 | $89,668 |
| 2022 | $3,670 | $252,423 | $164,513 | $87,910 |
| 2021 | $3,596 | $247,475 | $161,288 | $86,187 |
| 2019 | $3,548 | $240,137 | $156,505 | $83,632 |
| 2018 | $3,394 | $235,430 | $153,437 | $81,993 |
| 2016 | $3,141 | $226,290 | $147,480 | $78,810 |
| 2015 | $3,032 | $222,892 | $145,265 | $77,627 |
| 2014 | $3,021 | $218,527 | $142,420 | $76,107 |
Source: Public Records
Map
Nearby Homes
- 3369 California Ave
- 3404 Cerritos Ave
- 3403 Falcon Ave
- 3567 Brayton Ave
- 3368 Linden Ave
- 3560 Falcon Ave
- 1731 E Wardlow Rd
- 3383 Pasadena Ave Unit 52
- 3390 Elm Ave Unit 2
- 3306 Elm Ave
- 3323 Pasadena Ave
- 3430 Elm Ave
- 3565 Linden Ave Unit 255
- 3500 Elm Ave Unit 31
- 3641 Walnut Ave
- 3246 Locust Ave
- 201 E Pepper Dr
- 3754 California Ave
- 3625 Gardenia Ave
- 3211 Locust Ave
- 3226 Lemon Ave
- 3210 Lemon Ave
- 3238 Lemon Ave
- 3202 Lemon Ave
- 3221 Cerritos Ave
- 3242 Lemon Ave
- 3233 Cerritos Ave
- 3211 Cerritos Ave
- 3237 Cerritos Ave
- 3233 Cerritos Ave
- 1135 E 32nd St
- 3221 Lemon Ave
- 3223 Lemon Ave
- 3211 Lemon Ave
- 3254 Lemon Ave
- 3245 Cerritos Ave
- 3233 Lemon Ave
- 3201 Lemon Ave
- 3243 Lemon Ave
- 1108 E 32nd St