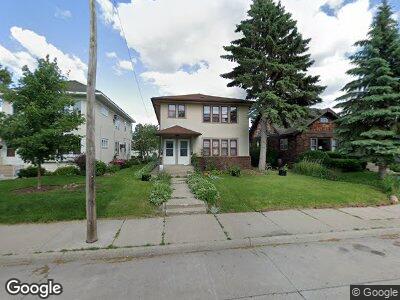
3219 34th Ave S Minneapolis, MN 55406
Longfellow NeighborhoodEstimated Value: $397,346 - $480,000
4
Beds
2
Baths
2,208
Sq Ft
$203/Sq Ft
Est. Value
About This Home
This home is located at 3219 34th Ave S, Minneapolis, MN 55406 and is currently estimated at $449,087, approximately $203 per square foot. 3219 34th Ave S is a home located in Hennepin County with nearby schools including Howe Elementary School, Hiawatha Community School, and Sanford Middle School.
Ownership History
Date
Name
Owned For
Owner Type
Purchase Details
Closed on
Mar 8, 2021
Sold by
Hb2 Llc
Bought by
Tharp Paul and Tharp Cara
Current Estimated Value
Home Financials for this Owner
Home Financials are based on the most recent Mortgage that was taken out on this home.
Original Mortgage
$318,750
Outstanding Balance
$293,423
Interest Rate
2.7%
Mortgage Type
New Conventional
Estimated Equity
$144,382
Purchase Details
Closed on
Sep 15, 2015
Sold by
Northern Realty Ventures Llc
Bought by
Hb2 Llc
Purchase Details
Closed on
Jun 29, 2015
Sold by
1St Fidelity Loan Servicing Llc
Bought by
Brunner Bruce
Purchase Details
Closed on
Mar 19, 2015
Sold by
Ruiz Doris
Bought by
1St Fidelity Loan Servicing Llc
Purchase Details
Closed on
Nov 30, 2010
Sold by
Ruiz Doris
Bought by
1St Fidelity Loan Servicing Llc
Purchase Details
Closed on
Mar 6, 1996
Sold by
Johnson Ardell
Bought by
Ocel Matthew and Ocel Emily
Purchase Details
Closed on
Dec 23, 1995
Sold by
Ocel Matthew Q
Bought by
Isaacs Abram M
Create a Home Valuation Report for This Property
The Home Valuation Report is an in-depth analysis detailing your home's value as well as a comparison with similar homes in the area
Home Values in the Area
Average Home Value in this Area
Purchase History
| Date | Buyer | Sale Price | Title Company |
|---|---|---|---|
| Tharp Paul | $425,000 | West Title Llc | |
| Hb2 Llc | $149,900 | None Available | |
| Brunner Bruce | $128,317 | Attorney | |
| 1St Fidelity Loan Servicing Llc | $125,000 | None Available | |
| 1St Fidelity Loan Servicing Llc | $308,762 | -- | |
| Ocel Matthew | $86,000 | -- | |
| Isaacs Abram M | $112,000 | -- | |
| Tharp Paul Paul | $425,000 | -- |
Source: Public Records
Mortgage History
| Date | Status | Borrower | Loan Amount |
|---|---|---|---|
| Open | Tharp Paul | $318,750 | |
| Previous Owner | Hb2 Llc | $200,000 |
Source: Public Records
Tax History Compared to Growth
Tax History
| Year | Tax Paid | Tax Assessment Tax Assessment Total Assessment is a certain percentage of the fair market value that is determined by local assessors to be the total taxable value of land and additions on the property. | Land | Improvement |
|---|---|---|---|---|
| 2023 | $6,511 | $407,000 | $126,000 | $281,000 |
| 2022 | $6,082 | $407,000 | $110,000 | $297,000 |
| 2021 | $5,742 | $358,000 | $92,000 | $266,000 |
| 2020 | $5,860 | $351,500 | $74,300 | $277,200 |
| 2019 | $5,473 | $331,500 | $49,500 | $282,000 |
| 2018 | $4,979 | $301,500 | $49,500 | $252,000 |
| 2017 | $4,630 | $247,000 | $45,000 | $202,000 |
| 2016 | $3,722 | $247,000 | $45,000 | $202,000 |
| 2015 | $3,343 | $215,500 | $45,000 | $170,500 |
| 2014 | -- | $187,500 | $45,000 | $142,500 |
Source: Public Records
Map
Nearby Homes
- 3141 33rd Ave S
- 3228 33rd Ave S
- 3401 32nd Ave S
- 3345 31st Ave S
- 3015 32nd Ave S
- 3403 38th Ave S
- 3429 31st Ave S
- 2928 34th Ave S
- 2614 30th Ave S
- 2929 36th Ave S
- 3029 29th Ave S
- 3520 32nd Ave S
- 3213 Minnehaha Ave
- 3100 29th Ave S
- 3545 Minnehaha Ave
- 3609 34th Ave S
- 2840 32nd Ave S
- 2815 E Lake St
- 3824 E 36th St
- 2809 31st Ave S
- 3219 34th Ave S
- 3215 34th Ave S
- 3223 34th Ave S
- 3227 34th Ave S
- 3211 34th Ave S
- 3229 34th Ave S
- 3203 34th Ave S
- 3218 35th Ave S
- 3222 35th Ave S
- 3214 35th Ave S
- 3231 34th Ave S
- 3226 35th Ave S
- 3218 3218 35th-Avenue-s
- 3210 35th Ave S
- 3230 35th Ave S
- 3208 35th Ave S
- 3201 34th Ave S
- 3216 34th Ave S
- 3220 34th Ave S
- 3212 34th Ave S