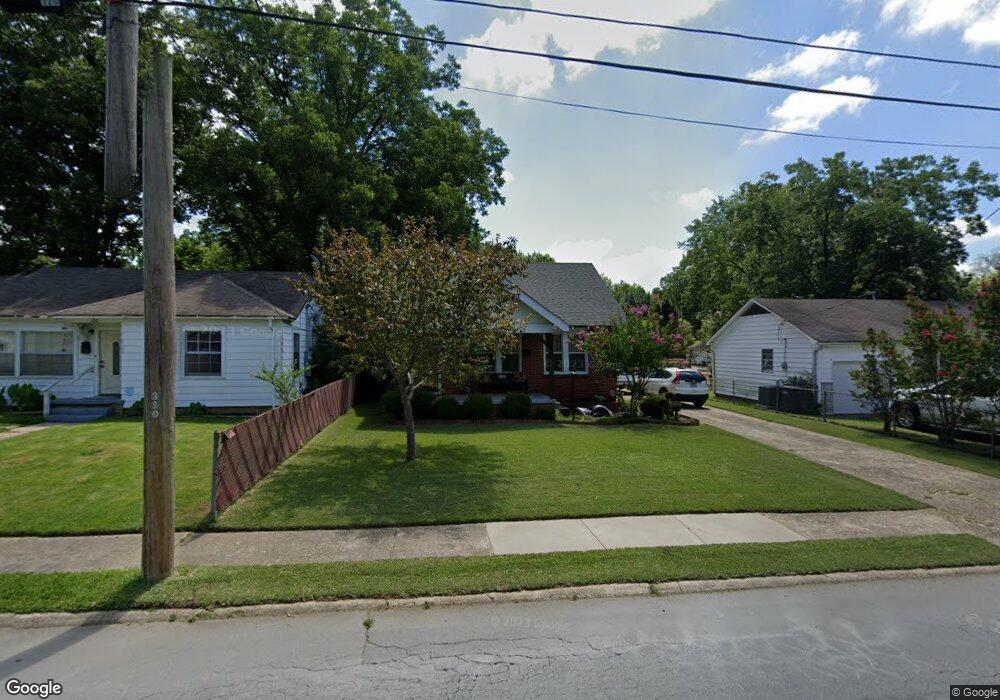
322 Cox St Benton, AR 72015
Estimated Value: $147,119 - $178,000
Studio
2
Baths
1,706
Sq Ft
$95/Sq Ft
Est. Value
About This Home
This home is located at 322 Cox St, Benton, AR 72015 and is currently estimated at $161,280, approximately $94 per square foot. 322 Cox St is a home located in Saline County with nearby schools including Angie Grant Elementary School, Benton Middle School, and Benton Junior High School.
Ownership History
Date
Name
Owned For
Owner Type
Purchase Details
Closed on
May 15, 2013
Sold by
Wright Fred E and Wright Anita S
Bought by
Melton Gary A and Melton Teresa J
Current Estimated Value
Home Financials for this Owner
Home Financials are based on the most recent Mortgage that was taken out on this home.
Original Mortgage
$52,000
Outstanding Balance
$36,980
Interest Rate
3.56%
Mortgage Type
New Conventional
Estimated Equity
$124,300
Purchase Details
Closed on
Jan 14, 2002
Bought by
Wright
Create a Home Valuation Report for This Property
The Home Valuation Report is an in-depth analysis detailing your home's value as well as a comparison with similar homes in the area
Home Values in the Area
Average Home Value in this Area
Purchase History
| Date | Buyer | Sale Price | Title Company |
|---|---|---|---|
| Melton Gary A | $100,000 | Arkansas Exrepss Title | |
| Wright | -- | -- |
Source: Public Records
Mortgage History
| Date | Status | Borrower | Loan Amount |
|---|---|---|---|
| Open | Melton Gary A | $52,000 |
Source: Public Records
Tax History
| Year | Tax Paid | Tax Assessment Tax Assessment Total Assessment is a certain percentage of the fair market value that is determined by local assessors to be the total taxable value of land and additions on the property. | Land | Improvement |
|---|---|---|---|---|
| 2025 | $989 | $21,913 | $2,873 | $19,040 |
| 2024 | $1,012 | $21,913 | $2,873 | $19,040 |
| 2023 | $564 | $21,913 | $2,873 | $19,040 |
| 2022 | $614 | $21,913 | $2,873 | $19,040 |
| 2021 | $567 | $17,000 | $2,050 | $14,950 |
| 2020 | $542 | $17,000 | $2,050 | $14,950 |
| 2019 | $542 | $17,000 | $2,050 | $14,950 |
| 2018 | $526 | $17,000 | $2,050 | $14,950 |
| 2017 | $486 | $17,000 | $2,050 | $14,950 |
| 2016 | $816 | $14,400 | $2,050 | $12,350 |
| 2015 | $452 | $14,400 | $2,050 | $12,350 |
| 2014 | $458 | $14,400 | $2,050 | $12,350 |
Source: Public Records
Map
Nearby Homes
- 513 Algood St
- 605 Revis St
- 1304 Gray St
- 712 S Border St
- 915 Schley St
- 821 Tulane
- 152 Border Cir
- 000 Neeley St
- 1001 Montclair St
- 228 S 3rd St
- 602 E Sevier St
- 000 Hwy 35 Tract B
- 518 E Sevier St
- 1120 Highway 35 Tract 3
- 1906 Whitlock Dr
- 1111 E North St
- 424 E Sevier St
- 121 S 1st St Unit A
- 701 Hester
- 707 Sunset
Your Personal Tour Guide
Ask me questions while you tour the home.