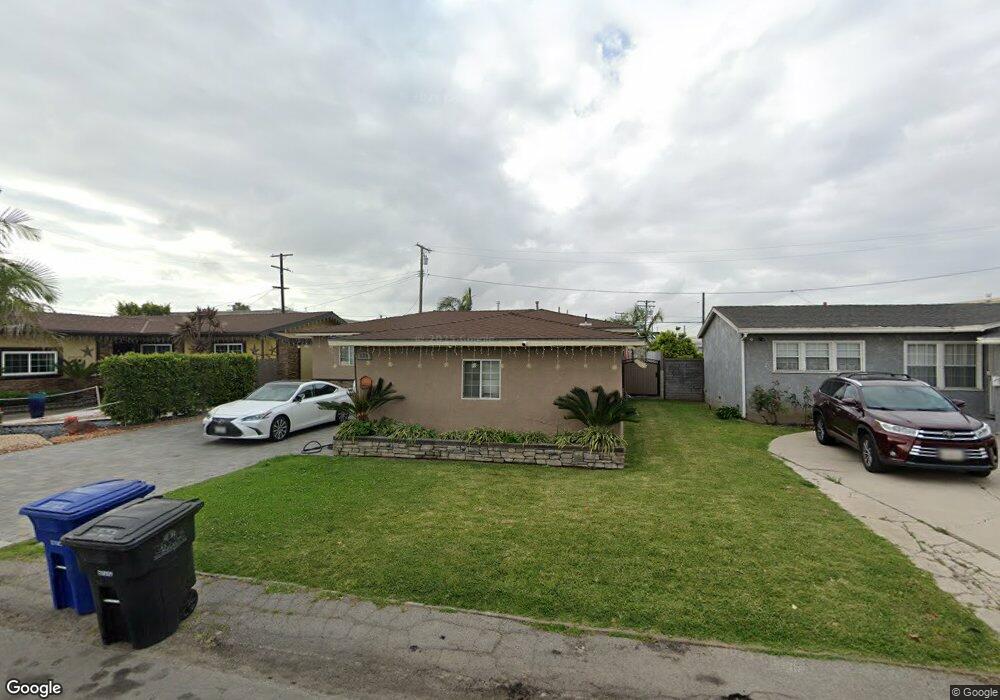
322 E 159th St Gardena, CA 90248
West Compton NeighborhoodEstimated Value: $733,000 - $821,000
3
Beds
2
Baths
1,474
Sq Ft
$519/Sq Ft
Est. Value
About This Home
This home is located at 322 E 159th St, Gardena, CA 90248 and is currently estimated at $764,373, approximately $518 per square foot. 322 E 159th St is a home located in Los Angeles County with nearby schools including Gardena Elementary School, Robert E. Peary Middle School, and Gardena Senior High School.
Ownership History
Date
Name
Owned For
Owner Type
Purchase Details
Closed on
Feb 22, 2017
Sold by
Catimon Patricia A
Bought by
Catinion Steve and Catimon Patricia A
Current Estimated Value
Home Financials for this Owner
Home Financials are based on the most recent Mortgage that was taken out on this home.
Original Mortgage
$298,278
Interest Rate
4.19%
Mortgage Type
VA
Purchase Details
Closed on
Apr 5, 2016
Sold by
Catimon Patricia A
Bought by
Catimon Patricia A
Purchase Details
Closed on
Apr 11, 2006
Sold by
The Margie Lois Smith Living Trust
Bought by
Smith Margie Lois
Home Financials for this Owner
Home Financials are based on the most recent Mortgage that was taken out on this home.
Original Mortgage
$230,000
Interest Rate
6.29%
Mortgage Type
New Conventional
Purchase Details
Closed on
Sep 28, 2004
Sold by
Smith Margie L
Bought by
The Margie Lois Smith Living Trust
Create a Home Valuation Report for This Property
The Home Valuation Report is an in-depth analysis detailing your home's value as well as a comparison with similar homes in the area
Home Values in the Area
Average Home Value in this Area
Purchase History
| Date | Buyer | Sale Price | Title Company |
|---|---|---|---|
| Catinion Steve | -- | Avenue 365 Lender Svcs Llc | |
| Catimon Patricia A | -- | None Available | |
| Smith Margie Lois | -- | Fidelity National Title Co | |
| The Margie Lois Smith Living Trust | -- | -- |
Source: Public Records
Mortgage History
| Date | Status | Borrower | Loan Amount |
|---|---|---|---|
| Closed | Catinion Steve | $298,278 | |
| Closed | Smith Margie Lois | $230,000 |
Source: Public Records
Tax History
| Year | Tax Paid | Tax Assessment Tax Assessment Total Assessment is a certain percentage of the fair market value that is determined by local assessors to be the total taxable value of land and additions on the property. | Land | Improvement |
|---|---|---|---|---|
| 2025 | $3,342 | $408,769 | $172,956 | $235,813 |
| 2024 | $3,342 | $400,755 | $169,565 | $231,190 |
| 2023 | $5,179 | $392,898 | $166,241 | $226,657 |
| 2022 | $4,929 | $385,195 | $162,982 | $222,213 |
| 2021 | $4,874 | $377,643 | $159,787 | $217,856 |
| 2019 | $4,717 | $366,445 | $155,049 | $211,396 |
| 2018 | $4,634 | $359,260 | $152,009 | $207,251 |
| 2016 | $780 | $35,778 | $14,061 | $21,717 |
| 2015 | $762 | $35,241 | $13,850 | $21,391 |
| 2014 | $761 | $34,551 | $13,579 | $20,972 |
Source: Public Records
Map
Nearby Homes
- 15328 S San Pedro St
- 15712 S Haskins Ave
- 15520 S Mckinley Ave
- 825 E Claude St
- 514 E Moorehaven Dr
- 902 E 163rd St
- 16952 Roa Dr
- 801 E Compton Blvd
- 16928 S Broadway
- 17202 Ambler Ave
- 705 S Corlett Ave
- 16619 S Denver Ave
- 2412 W Raymond St
- 15813 Bonsallo Ave
- 620 S Barclay Ave
- 2215 W 153rd St
- 640 W Redondo Beach Blvd
- 1033 E 149th St
- 2202 W 153rd St
- 523 W 170th St
Your Personal Tour Guide
Ask me questions while you tour the home.