Estimated Value: $190,624 - $272,000
--
Bed
--
Bath
1,881
Sq Ft
$121/Sq Ft
Est. Value
About This Home
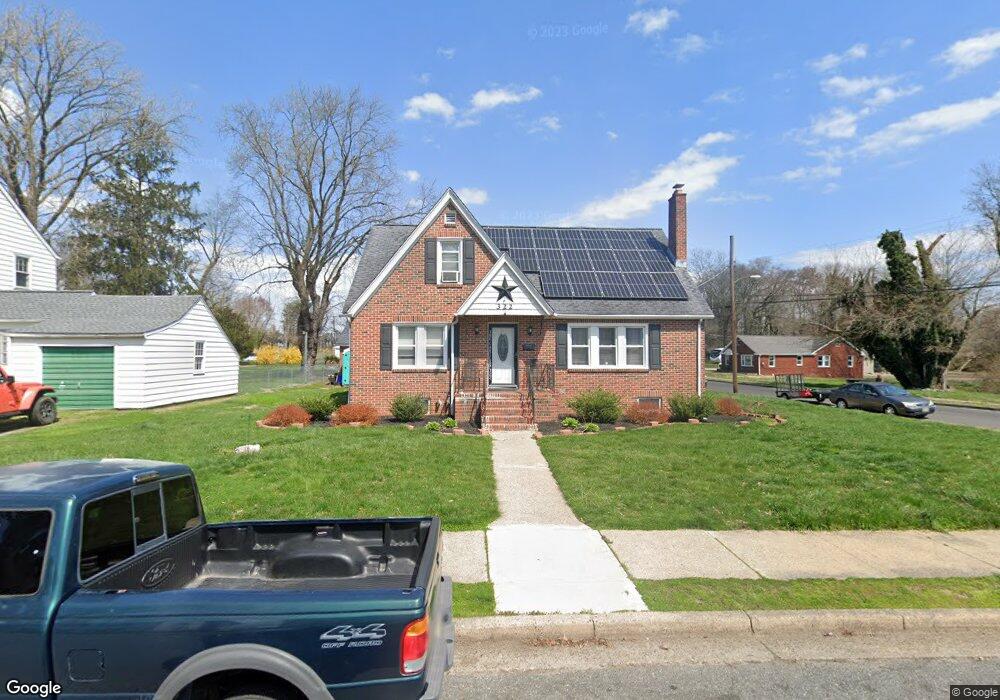
This home is located at 322 Fenwick Ave, Salem, NJ 08079 and is currently estimated at $227,656, approximately $121 per square foot. 322 Fenwick Ave is a home located in Salem County with nearby schools including John Fenwick Elementary School, Salem Middle School, and Salem High School.
Ownership History
Date
Name
Owned For
Owner Type
Purchase Details
Closed on
Jul 27, 2007
Sold by
Saunders Darryl V and Saunders Tanita J
Bought by
Carter Bobby and Carter Rosemary Y
Current Estimated Value
Home Financials for this Owner
Home Financials are based on the most recent Mortgage that was taken out on this home.
Original Mortgage
$156,750
Outstanding Balance
$99,601
Interest Rate
6.73%
Mortgage Type
New Conventional
Estimated Equity
$128,055
Purchase Details
Closed on
Sep 27, 1996
Sold by
Wilmington Svgs Fund Society Fsb
Bought by
Saunders Darryl and Saunders Tanita J
Home Financials for this Owner
Home Financials are based on the most recent Mortgage that was taken out on this home.
Original Mortgage
$45,600
Interest Rate
7.9%
Purchase Details
Closed on
Apr 5, 1996
Sold by
Cooksey John B
Bought by
Wilmington Svgs Fund Society Fsb
Create a Home Valuation Report for This Property
The Home Valuation Report is an in-depth analysis detailing your home's value as well as a comparison with similar homes in the area
Home Values in the Area
Average Home Value in this Area
Purchase History
| Date | Buyer | Sale Price | Title Company |
|---|---|---|---|
| Carter Bobby | $165,000 | -- | |
| Saunders Darryl | $48,000 | -- | |
| Wilmington Svgs Fund Society Fsb | -- | -- |
Source: Public Records
Mortgage History
| Date | Status | Borrower | Loan Amount |
|---|---|---|---|
| Open | Carter Bobby | $156,750 | |
| Previous Owner | Saunders Darryl | $45,600 | |
| Closed | Wilmington Svgs Fund Society Fsb | -- |
Source: Public Records
Tax History Compared to Growth
Tax History
| Year | Tax Paid | Tax Assessment Tax Assessment Total Assessment is a certain percentage of the fair market value that is determined by local assessors to be the total taxable value of land and additions on the property. | Land | Improvement |
|---|---|---|---|---|
| 2025 | $6,315 | $76,800 | $15,700 | $61,100 |
| 2024 | $6,037 | $76,800 | $15,700 | $61,100 |
| 2023 | $6,037 | $76,800 | $15,700 | $61,100 |
| 2022 | $5,773 | $76,800 | $15,700 | $61,100 |
| 2021 | $5,574 | $76,800 | $15,700 | $61,100 |
| 2020 | $5,462 | $76,800 | $15,700 | $61,100 |
| 2019 | $5,429 | $76,800 | $15,700 | $61,100 |
| 2018 | $5,310 | $76,800 | $15,700 | $61,100 |
| 2017 | $5,245 | $76,800 | $15,700 | $61,100 |
| 2016 | $6,978 | $178,200 | $35,500 | $142,700 |
| 2015 | $6,889 | $178,200 | $35,500 | $142,700 |
| 2014 | $6,854 | $178,200 | $35,500 | $142,700 |
Source: Public Records
Map
Nearby Homes
- 155 N Union St
- 318 Fenwick Ave
- 174 N Union St
- 327 Fenwick Ave
- 177 N Union St
- 325 Fenwick Ave
- 323 Fenwick Ave
- 4 N Union St
- 176 N Union St
- 319 Fenwick Ave
- Union St
- 145 N Union St
- 310 Fenwick Ave
- 174 New Union St
- 369 Fenwick Ave
- 330 Morrison Ave
- 326 Morrison Ave
- 336 Morrison Ave
- 180 N Union St
- 322 Morrison Ave