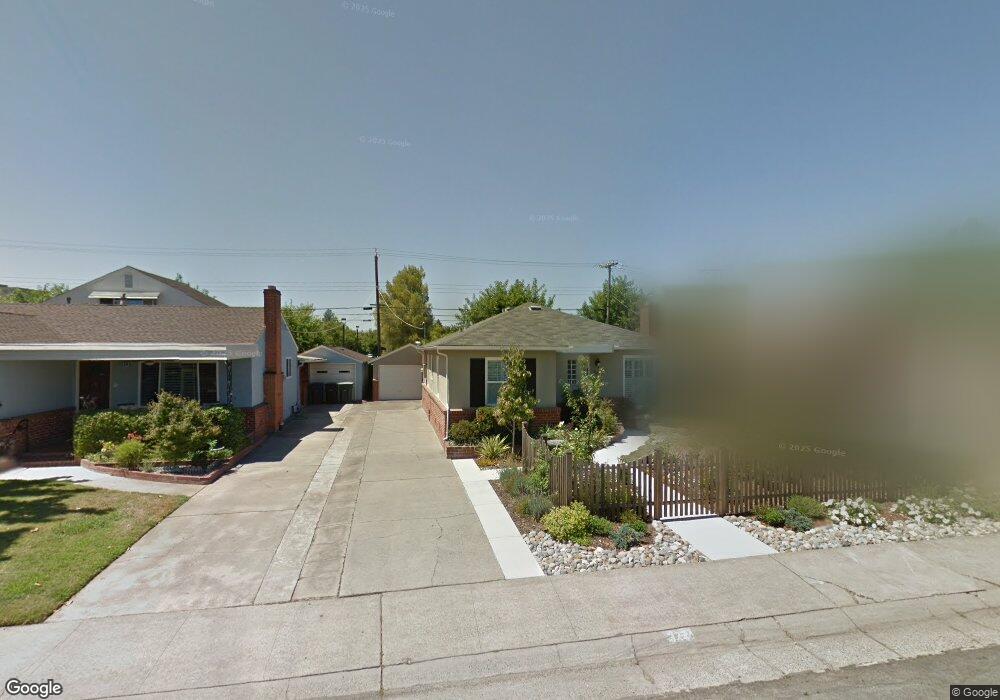
322 Lagomarsino Way Sacramento, CA 95819
East Sacramento NeighborhoodEstimated Value: $573,000 - $748,000
2
Beds
1
Bath
1,009
Sq Ft
$645/Sq Ft
Est. Value
About This Home
This home is located at 322 Lagomarsino Way, Sacramento, CA 95819 and is currently estimated at $651,080, approximately $645 per square foot. 322 Lagomarsino Way is a home located in Sacramento County with nearby schools including Caleb Greenwood Elementary, Miwok Middle School, and Hiram W. Johnson High School.
Ownership History
Date
Name
Owned For
Owner Type
Purchase Details
Closed on
Jul 21, 2008
Sold by
Abdu Anne Eileen and Starns Anne Eileen
Bought by
Starns Anne Eileen and Starns Anne Eileen
Current Estimated Value
Purchase Details
Closed on
May 19, 2008
Sold by
Abdu Anne Eileen
Bought by
Starns Anne Eileen
Purchase Details
Closed on
Mar 24, 2008
Sold by
Cunningham Samuel F and Cunningham Deborah L
Bought by
Abdu Anne Eileen
Purchase Details
Closed on
Oct 24, 2007
Sold by
Leone Karen A
Bought by
Cunningham Samuel F and Cunningham Deborah L
Purchase Details
Closed on
Dec 31, 1993
Sold by
Geitner Ethel V and Kuhnel Paul P
Bought by
Leone Karen A
Home Financials for this Owner
Home Financials are based on the most recent Mortgage that was taken out on this home.
Original Mortgage
$130,614
Interest Rate
7.09%
Mortgage Type
FHA
Create a Home Valuation Report for This Property
The Home Valuation Report is an in-depth analysis detailing your home's value as well as a comparison with similar homes in the area
Home Values in the Area
Average Home Value in this Area
Purchase History
| Date | Buyer | Sale Price | Title Company |
|---|---|---|---|
| Starns Anne Eileen | -- | None Available | |
| Starns Anne Eileen | -- | None Available | |
| Abdu Anne Eileen | $372,000 | North American Title Company | |
| Cunningham Samuel F | $310,500 | North American Title Company | |
| Leone Karen A | $133,500 | Commonwealth Land Title Ins |
Source: Public Records
Mortgage History
| Date | Status | Borrower | Loan Amount |
|---|---|---|---|
| Previous Owner | Leone Karen A | $130,614 |
Source: Public Records
Tax History Compared to Growth
Tax History
| Year | Tax Paid | Tax Assessment Tax Assessment Total Assessment is a certain percentage of the fair market value that is determined by local assessors to be the total taxable value of land and additions on the property. | Land | Improvement |
|---|---|---|---|---|
| 2025 | $5,605 | $488,616 | $275,832 | $212,784 |
| 2024 | $5,605 | $479,036 | $270,424 | $208,612 |
| 2023 | $5,471 | $469,644 | $265,122 | $204,522 |
| 2022 | $5,378 | $460,436 | $259,924 | $200,512 |
| 2021 | $5,120 | $451,409 | $254,828 | $196,581 |
| 2020 | $5,164 | $446,782 | $252,216 | $194,566 |
| 2019 | $5,053 | $438,022 | $247,271 | $190,751 |
| 2018 | $4,920 | $429,434 | $242,423 | $187,011 |
| 2017 | $4,851 | $421,015 | $237,670 | $183,345 |
| 2016 | $4,767 | $412,760 | $233,010 | $179,750 |
| 2015 | $4,697 | $406,560 | $229,510 | $177,050 |
| 2014 | $4,568 | $398,597 | $225,015 | $173,582 |
Source: Public Records
Map
Nearby Homes
- 328 Lagomarsino Way
- 318 Lagomarsino Way
- 338 Lagomarsino Way
- 5233 Sutter Park Way
- 5311 Aileen Way
- 5400 C St
- 5241 Sutter Park Way
- 300 Lagomarsino Way
- 5308 C St
- 344 Lagomarsino Way
- 5300 C St
- 5310 Aileen Way
- 5315 Aileen Way
- 5500 C St
- 5225 Sutter Park Way
- 5214 C St
- 5314 Aileen Way
- 5249 Sutter Park Way
- 5506 C St
- 5319 Aileen Way