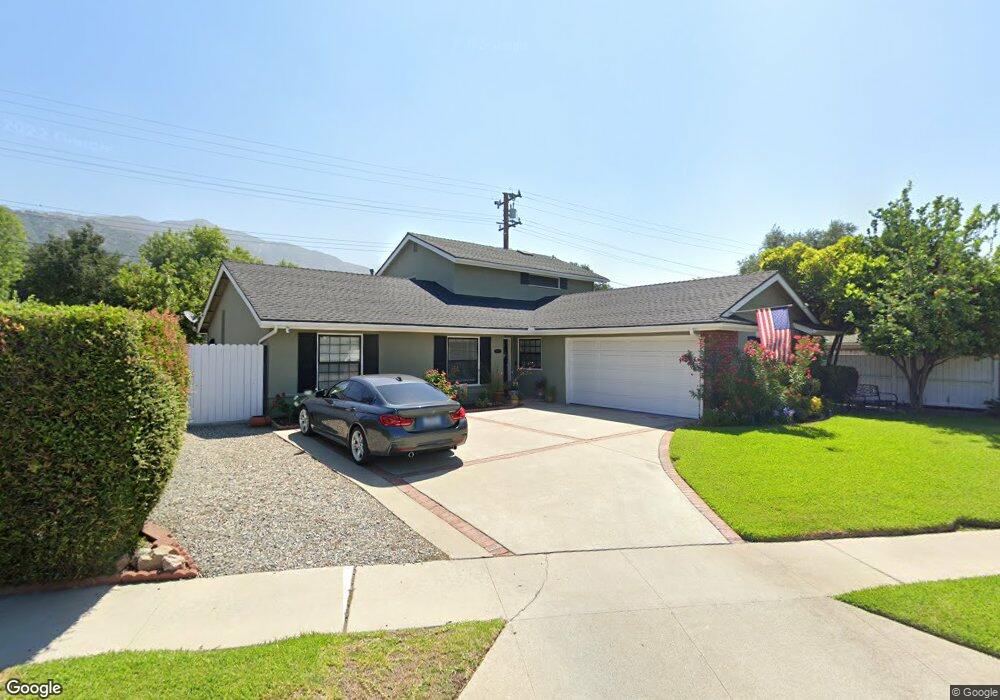
322 N Mountain Ave Monrovia, CA 91016
Estimated Value: $1,260,005 - $1,477,000
5
Beds
3
Baths
1,929
Sq Ft
$708/Sq Ft
Est. Value
About This Home
This home is located at 322 N Mountain Ave, Monrovia, CA 91016 and is currently estimated at $1,366,251, approximately $708 per square foot. 322 N Mountain Ave is a home located in Los Angeles County with nearby schools including Bradoaks Elementary Science Academy, Clifton Middle School, and Monrovia High School.
Ownership History
Date
Name
Owned For
Owner Type
Purchase Details
Closed on
Jan 29, 2009
Sold by
Seltzer Greg S and Seltzer Kim
Bought by
Seltzer Gregory S and Seltzer Kim
Current Estimated Value
Home Financials for this Owner
Home Financials are based on the most recent Mortgage that was taken out on this home.
Original Mortgage
$100,000
Outstanding Balance
$63,009
Interest Rate
5.04%
Mortgage Type
Credit Line Revolving
Estimated Equity
$1,303,242
Purchase Details
Closed on
Nov 6, 2006
Sold by
Seltzer Greg S and Seltzer Kim
Bought by
Seltzer Gregory S and Seltzer Kim
Purchase Details
Closed on
Nov 23, 1999
Sold by
Family Trust Trump Gerald E And Carole A Trs
Bought by
Seltzer Greg S and Seltzer Kim
Home Financials for this Owner
Home Financials are based on the most recent Mortgage that was taken out on this home.
Original Mortgage
$271,200
Interest Rate
7.84%
Purchase Details
Closed on
Oct 28, 1998
Sold by
Trump Gerald E and Trump Carole A
Bought by
Trump Gerald E and Trump Carole A
Create a Home Valuation Report for This Property
The Home Valuation Report is an in-depth analysis detailing your home's value as well as a comparison with similar homes in the area
Home Values in the Area
Average Home Value in this Area
Purchase History
| Date | Buyer | Sale Price | Title Company |
|---|---|---|---|
| Seltzer Gregory S | -- | First American Title Company | |
| Seltzer Gregory S | -- | None Available | |
| Seltzer Greg S | $339,000 | Fidelity National Title Ins | |
| Trump Gerald E | -- | -- |
Source: Public Records
Mortgage History
| Date | Status | Borrower | Loan Amount |
|---|---|---|---|
| Open | Seltzer Gregory S | $100,000 | |
| Previous Owner | Seltzer Greg S | $271,200 | |
| Closed | Seltzer Greg S | $33,900 |
Source: Public Records
Tax History Compared to Growth
Tax History
| Year | Tax Paid | Tax Assessment Tax Assessment Total Assessment is a certain percentage of the fair market value that is determined by local assessors to be the total taxable value of land and additions on the property. | Land | Improvement |
|---|---|---|---|---|
| 2025 | $7,220 | $521,010 | $268,649 | $252,361 |
| 2024 | $7,220 | $510,795 | $263,382 | $247,413 |
| 2023 | $7,058 | $500,780 | $258,218 | $242,562 |
| 2022 | $6,857 | $490,961 | $253,155 | $237,806 |
| 2021 | $6,719 | $481,336 | $248,192 | $233,144 |
| 2019 | $6,407 | $467,062 | $240,832 | $226,230 |
| 2018 | $6,186 | $457,905 | $236,110 | $221,795 |
| 2016 | $5,941 | $440,127 | $226,943 | $213,184 |
| 2015 | $5,812 | $433,517 | $223,535 | $209,982 |
| 2014 | $5,755 | $425,026 | $219,157 | $205,869 |
Source: Public Records
Map
Nearby Homes
- 337 Meadow Ln
- 549 Norumbega Dr
- 336 N Bradoaks Ave
- 700 Norumbega Dr
- 824 Ocean View Ave
- 135 N Shamrock Ave
- 835 E Foothill Blvd
- 633 Norumbega Dr
- 11 Deodar Ln
- 61 Palm Hill Ln
- 100 Palm Hill Ln
- 420 E Foothill Blvd
- 553 Norumbega Dr
- 314 May Ave
- 426 N Canyon Blvd
- 375 N Canyon Blvd
- 430 N Canyon Blvd
- 425 N Canyon Blvd
- 188 Deodar Ln
- 1158 Norumbega Dr
- 316 N Mountain Ave
- 326 N Mountain Ave
- 334 N Mountain Ave
- 321 N Mountain Ave
- 325 N Mountain Ave
- 315 N Mountain Ave
- 321 Oakcliff Rd
- 325 Oakcliff Rd
- 340 N Mountain Ave
- 312 N Mountain Ave
- 313 Oakcliff Rd
- 329 Maryknoll Cir
- 329 Oakcliff Rd
- 308 N Mountain Ave
- 346 N Mountain Ave
- 333 Maryknoll Cir
- 333 Oakcliff Rd
- 307 Oakcliff Rd
- 345 Maryknoll Cir