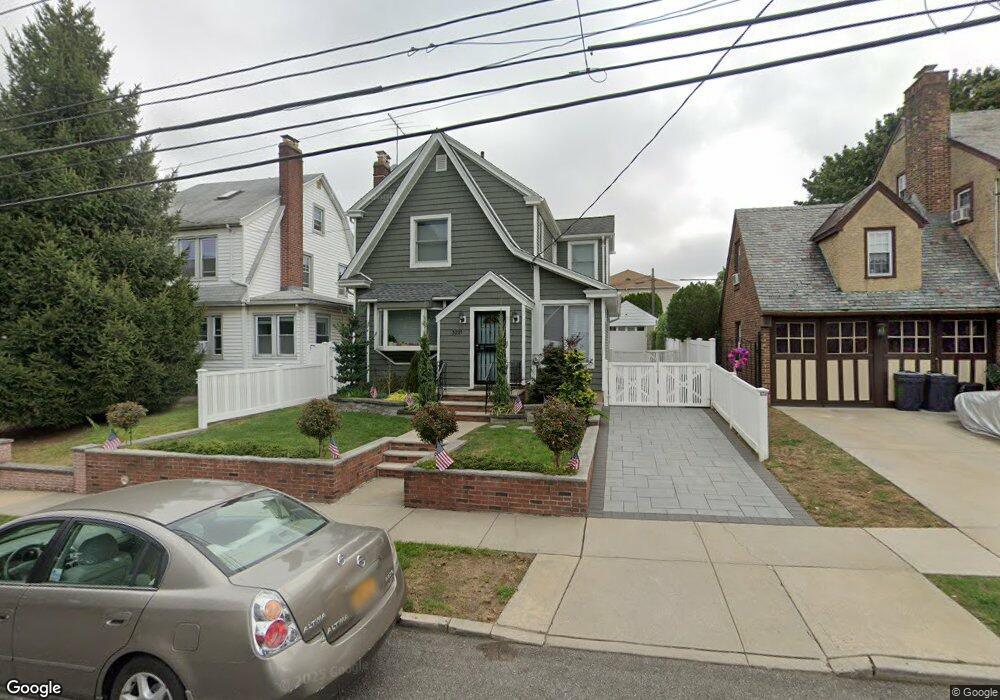
3221 169th St Flushing, NY 11358
Murray Hill-Broadway NeighborhoodEstimated Value: $1,226,520 - $1,293,000
Studio
--
Bath
1,823
Sq Ft
$698/Sq Ft
Est. Value
About This Home
This home is located at 3221 169th St, Flushing, NY 11358 and is currently estimated at $1,271,630, approximately $697 per square foot. 3221 169th St is a home located in Queens County with nearby schools including P.S. 32 - State Street, I.S. 25 Adrien Block, and Francis Lewis High School.
Ownership History
Date
Name
Owned For
Owner Type
Purchase Details
Closed on
Nov 4, 2021
Sold by
Mercer Joyce
Bought by
Kopytko Christine A
Current Estimated Value
Purchase Details
Closed on
Nov 9, 2006
Sold by
Losak Mitch and Losak Vera
Bought by
Kopytko Christine A and Mercer Joyce
Home Financials for this Owner
Home Financials are based on the most recent Mortgage that was taken out on this home.
Original Mortgage
$606,000
Interest Rate
6.39%
Mortgage Type
Purchase Money Mortgage
Purchase Details
Closed on
Jun 26, 2001
Sold by
Losak Vera
Bought by
Losak Mitch and Losak Vera
Purchase Details
Closed on
May 13, 1996
Sold by
Zerillo Anthony and Zerillo Rose Marie
Bought by
Losak Vera
Create a Home Valuation Report for This Property
The Home Valuation Report is an in-depth analysis detailing your home's value as well as a comparison with similar homes in the area
Home Values in the Area
Average Home Value in this Area
Purchase History
| Date | Buyer | Sale Price | Title Company |
|---|---|---|---|
| Kopytko Christine A | -- | -- | |
| Kopytko Christine A | $757,500 | -- | |
| Losak Mitch | -- | -- | |
| Losak Vera | -- | American Title Ins Co |
Source: Public Records
Mortgage History
| Date | Status | Borrower | Loan Amount |
|---|---|---|---|
| Previous Owner | Kopytko Christine A | $606,000 |
Source: Public Records
Tax History
| Year | Tax Paid | Tax Assessment Tax Assessment Total Assessment is a certain percentage of the fair market value that is determined by local assessors to be the total taxable value of land and additions on the property. | Land | Improvement |
|---|---|---|---|---|
| 2025 | $10,229 | $53,084 | $17,798 | $35,286 |
| 2024 | $10,242 | $52,331 | $18,218 | $34,113 |
| 2023 | $9,796 | $50,171 | $19,131 | $31,040 |
| 2022 | $8,864 | $65,100 | $24,000 | $41,100 |
| 2021 | $7,537 | $52,500 | $19,740 | $32,760 |
| 2020 | $7,578 | $51,540 | $19,740 | $31,800 |
| 2019 | $7,358 | $56,760 | $19,740 | $37,020 |
| 2018 | $6,791 | $34,772 | $14,054 | $20,718 |
| 2017 | $6,387 | $32,804 | $12,419 | $20,385 |
| 2016 | $5,890 | $32,804 | $12,419 | $20,385 |
| 2015 | $3,513 | $30,999 | $13,698 | $17,301 |
| 2014 | $3,513 | $30,477 | $16,169 | $14,308 |
Source: Public Records
Map
Nearby Homes
- 29-37 168th St
- 29-31 170th St
- 2952 172nd St
- 3228 Utopia Pkwy
- 29 Avenue
- 16608 29th Ave
- 164-04 33rd Ave
- 32-35 164th St
- 27-25 168th St
- 3369 164th St
- 33-81 164th St
- 2724 166th St
- 28-07 172nd St
- 35-63 168th St
- 35-62 168th St
- 34-12 192nd St
- 36-07 171st St Unit 35
- 32-19 Jordan St
- 29-35 162nd St
- 167-10 Crocheron Ave Unit 1F
Your Personal Tour Guide
Ask me questions while you tour the home.