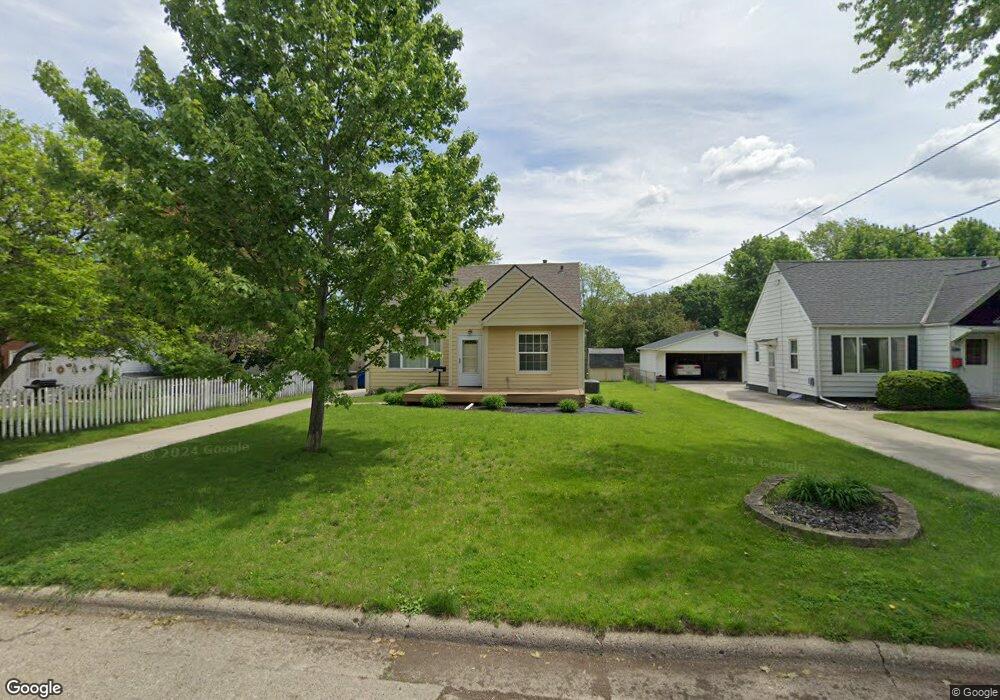
3221 47th St Des Moines, IA 50310
Beaverdale NeighborhoodEstimated Value: $218,943 - $235,000
2
Beds
1
Bath
1,052
Sq Ft
$216/Sq Ft
Est. Value
About This Home
This home is located at 3221 47th St, Des Moines, IA 50310 and is currently estimated at $227,486, approximately $216 per square foot. 3221 47th St is a home located in Polk County with nearby schools including Moore Elementary School, Meredith Middle School, and Hoover High School.
Ownership History
Date
Name
Owned For
Owner Type
Purchase Details
Closed on
Jun 28, 2002
Sold by
Sheeley Anne and Sheeley Matthew S
Bought by
Groves Ryan P
Current Estimated Value
Home Financials for this Owner
Home Financials are based on the most recent Mortgage that was taken out on this home.
Original Mortgage
$75,000
Outstanding Balance
$32,137
Interest Rate
7%
Estimated Equity
$195,349
Purchase Details
Closed on
Nov 24, 1998
Sold by
The Michael Group
Bought by
Bunz Anne M
Home Financials for this Owner
Home Financials are based on the most recent Mortgage that was taken out on this home.
Original Mortgage
$80,550
Interest Rate
6.87%
Purchase Details
Closed on
Jun 1, 1998
Sold by
Brady Vera Lee
Bought by
Michael Group
Home Financials for this Owner
Home Financials are based on the most recent Mortgage that was taken out on this home.
Original Mortgage
$75,182
Interest Rate
7.32%
Create a Home Valuation Report for This Property
The Home Valuation Report is an in-depth analysis detailing your home's value as well as a comparison with similar homes in the area
Home Values in the Area
Average Home Value in this Area
Purchase History
| Date | Buyer | Sale Price | Title Company |
|---|---|---|---|
| Groves Ryan P | $102,000 | -- | |
| Bunz Anne M | $89,000 | -- | |
| Michael Group | $64,500 | -- |
Source: Public Records
Mortgage History
| Date | Status | Borrower | Loan Amount |
|---|---|---|---|
| Open | Groves Ryan P | $75,000 | |
| Previous Owner | Bunz Anne M | $80,550 | |
| Previous Owner | Michael Group | $75,182 |
Source: Public Records
Tax History Compared to Growth
Tax History
| Year | Tax Paid | Tax Assessment Tax Assessment Total Assessment is a certain percentage of the fair market value that is determined by local assessors to be the total taxable value of land and additions on the property. | Land | Improvement |
|---|---|---|---|---|
| 2025 | $3,590 | $202,200 | $57,300 | $144,900 |
| 2024 | $3,590 | $182,500 | $50,900 | $131,600 |
| 2023 | $3,710 | $182,500 | $50,900 | $131,600 |
| 2022 | $3,682 | $157,400 | $44,900 | $112,500 |
| 2021 | $3,696 | $157,400 | $44,900 | $112,500 |
| 2020 | $3,840 | $148,100 | $42,000 | $106,100 |
| 2019 | $3,588 | $148,100 | $42,000 | $106,100 |
| 2018 | $3,552 | $133,500 | $37,200 | $96,300 |
| 2017 | $3,254 | $133,500 | $37,200 | $96,300 |
| 2016 | $3,170 | $120,300 | $32,900 | $87,400 |
| 2015 | $3,170 | $120,300 | $32,900 | $87,400 |
| 2014 | $2,984 | $116,500 | $31,400 | $85,100 |
Source: Public Records
Map
Nearby Homes