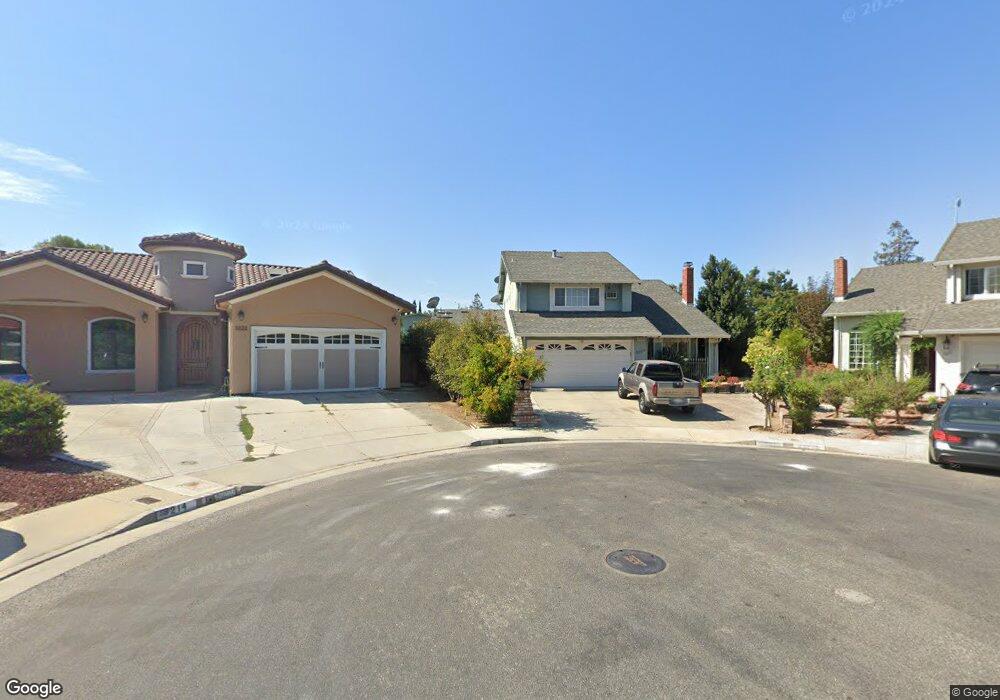
3223 Blue Creek Ct San Jose, CA 95135
Silverland NeighborhoodEstimated Value: $1,599,000 - $2,244,000
5
Beds
4
Baths
1,757
Sq Ft
$1,117/Sq Ft
Est. Value
About This Home
This home is located at 3223 Blue Creek Ct, San Jose, CA 95135 and is currently estimated at $1,962,799, approximately $1,117 per square foot. 3223 Blue Creek Ct is a home located in Santa Clara County with nearby schools including Evergreen Elementary School, Chaboya Middle School, and Evergreen Valley High School.
Ownership History
Date
Name
Owned For
Owner Type
Purchase Details
Closed on
Jun 24, 2021
Sold by
Azurin Mel B and Azurin Mel
Bought by
Azurin Mel B
Current Estimated Value
Home Financials for this Owner
Home Financials are based on the most recent Mortgage that was taken out on this home.
Original Mortgage
$345,000
Outstanding Balance
$312,355
Interest Rate
2.9%
Mortgage Type
New Conventional
Estimated Equity
$1,650,445
Purchase Details
Closed on
Mar 18, 1999
Sold by
Azurin Mel and Pipit Marylou B
Bought by
Azurin Mel
Home Financials for this Owner
Home Financials are based on the most recent Mortgage that was taken out on this home.
Original Mortgage
$264,800
Interest Rate
6.73%
Purchase Details
Closed on
Aug 20, 1998
Sold by
Pipit Benedicto A and Pipit Marylou B
Bought by
Azurin Mel and Pipit Marylou B
Purchase Details
Closed on
Jul 9, 1996
Sold by
Valones Teresita B
Bought by
Pipit Benedicto A and Pipit Marylou B
Create a Home Valuation Report for This Property
The Home Valuation Report is an in-depth analysis detailing your home's value as well as a comparison with similar homes in the area
Home Values in the Area
Average Home Value in this Area
Purchase History
| Date | Buyer | Sale Price | Title Company |
|---|---|---|---|
| Azurin Mel B | -- | Old Republic Title Company | |
| Azurin Mel | $133,000 | Financial Title Company | |
| Azurin Mel | -- | -- | |
| Pipit Benedicto A | $245,000 | -- |
Source: Public Records
Mortgage History
| Date | Status | Borrower | Loan Amount |
|---|---|---|---|
| Open | Azurin Mel B | $345,000 | |
| Closed | Azurin Mel | $264,800 |
Source: Public Records
Tax History Compared to Growth
Tax History
| Year | Tax Paid | Tax Assessment Tax Assessment Total Assessment is a certain percentage of the fair market value that is determined by local assessors to be the total taxable value of land and additions on the property. | Land | Improvement |
|---|---|---|---|---|
| 2025 | $9,278 | $619,228 | $250,823 | $368,405 |
| 2024 | $9,278 | $607,087 | $245,905 | $361,182 |
| 2023 | $9,087 | $595,184 | $241,084 | $354,100 |
| 2022 | $9,042 | $583,514 | $236,357 | $347,157 |
| 2021 | $8,868 | $572,073 | $231,723 | $340,350 |
| 2020 | $8,480 | $566,208 | $229,347 | $336,861 |
| 2019 | $8,261 | $555,106 | $224,850 | $330,256 |
| 2018 | $8,169 | $544,223 | $220,442 | $323,781 |
| 2017 | $8,036 | $533,553 | $216,120 | $317,433 |
| 2016 | $7,662 | $523,092 | $211,883 | $311,209 |
| 2015 | $7,558 | $515,236 | $208,701 | $306,535 |
| 2014 | $6,918 | $505,144 | $204,613 | $300,531 |
Source: Public Records
Map
Nearby Homes
- 3176 Arcola Ct
- 3145 Chillum Ct
- 2930 Silverland Ct
- 3114 Pinot Grigio Place
- 2886 Damico Dr
- 3874 Forester Ct
- 3843 Yerba Buena Ave
- 3947 Timberline Dr
- 3198 Vintage Crest Dr
- 2725 Los Altos Dr
- 2652 Orinda Dr
- 3123 Oakgate Way
- 2673 Toy Ln
- 3034 Beckley Dr
- 4063 Cadwallader Ave
- 2176 Laddie Ct
- 2114 Bennighof Ct
- 3211 Pentland Ct
- 4072 Bouquet Park Ln
- 3422 Glenprosen Ct
- 3215 Blue Creek Ct
- 2881 Urzi Ct
- 3222 Blue Creek Ct
- 2877 Urzi Ct
- 3207 Blue Creek Ct
- 2873 Urzi Ct
- 3218 Urzi Dr
- 3214 Blue Creek Ct
- 2885 Urzi Ct
- 3210 Urzi Dr
- 3206 Blue Creek Ct
- 2869 Urzi Ct
- 3202 Urzi Dr
- 2889 Urzi Ct
- 3225 Terra Cotta Dr
- 2882 Urzi Ct
- 3217 Terra Cotta Dr
- 2878 Urzi Ct
- 3233 Terra Cotta Dr
- 3242 Urzi Dr