Estimated Value: $901,000 - $1,249,000
4
Beds
2
Baths
2,656
Sq Ft
$407/Sq Ft
Est. Value
About This Home
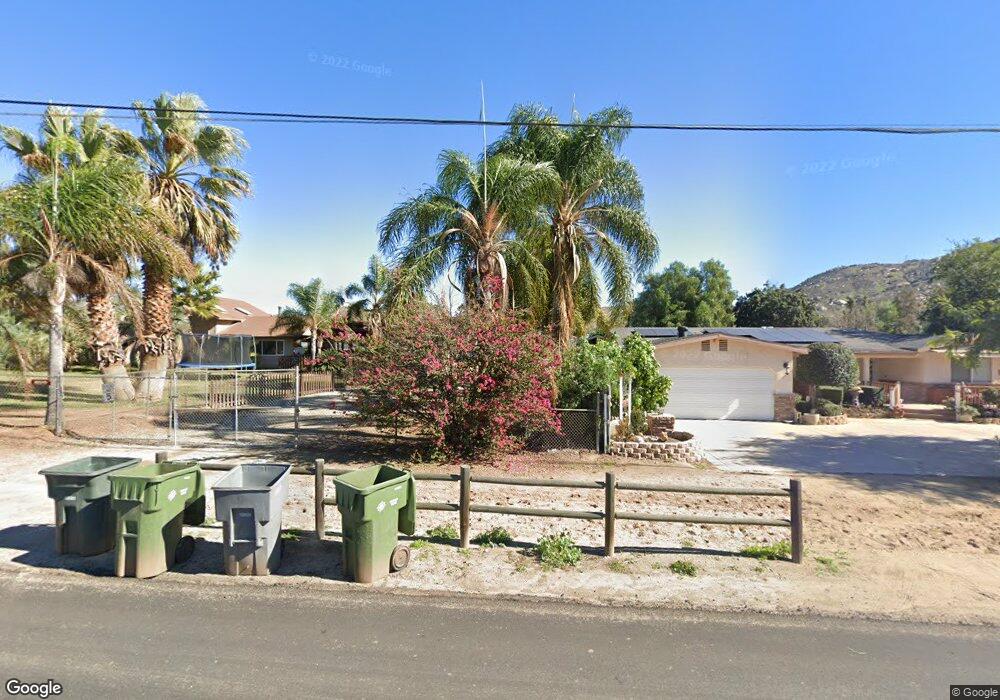
This home is located at 3223 Temescal Ave, Norco, CA 92860 and is currently estimated at $1,082,051, approximately $407 per square foot. 3223 Temescal Ave is a home located in Riverside County with nearby schools including Sierra Vista Elementary School, Norco Intermediate School, and Norco High School.
Ownership History
Date
Name
Owned For
Owner Type
Purchase Details
Closed on
Sep 19, 2022
Sold by
Fraser Kathleen
Bought by
Fraser Kathleen C Trust and Fraser
Current Estimated Value
Purchase Details
Closed on
Feb 2, 2010
Sold by
Proado Susana
Bought by
Moreno Raul
Purchase Details
Closed on
Jan 21, 2010
Sold by
Moreno Raul
Bought by
Fraser Kathleen
Purchase Details
Closed on
Jul 29, 2009
Sold by
Deutsche Bank National Trust Company
Bought by
Moreno Raul
Purchase Details
Closed on
Jun 24, 2009
Sold by
Farden Frank and Farden Renee K
Bought by
Deutsche Bank National Trust Company
Purchase Details
Closed on
Oct 28, 1999
Sold by
Ferris Dennis L and Ferris Denna D
Bought by
Farden Frank and Farden Renee K
Home Financials for this Owner
Home Financials are based on the most recent Mortgage that was taken out on this home.
Original Mortgage
$259,950
Interest Rate
8.87%
Mortgage Type
Purchase Money Mortgage
Create a Home Valuation Report for This Property
The Home Valuation Report is an in-depth analysis detailing your home's value as well as a comparison with similar homes in the area
Home Values in the Area
Average Home Value in this Area
Purchase History
| Date | Buyer | Sale Price | Title Company |
|---|---|---|---|
| Fraser Kathleen C Trust | -- | None Listed On Document | |
| Moreno Raul | -- | Lsi Title Agency | |
| Fraser Kathleen | $470,000 | Lsi Title Agency | |
| Moreno Raul | $315,000 | Lsi Title Agency | |
| Deutsche Bank National Trust Company | $300,000 | Security Union Title Ins Co | |
| Farden Frank | $328,000 | American Title Co |
Source: Public Records
Mortgage History
| Date | Status | Borrower | Loan Amount |
|---|---|---|---|
| Previous Owner | Farden Frank | $259,950 | |
| Closed | Farden Frank | $64,950 |
Source: Public Records
Tax History
| Year | Tax Paid | Tax Assessment Tax Assessment Total Assessment is a certain percentage of the fair market value that is determined by local assessors to be the total taxable value of land and additions on the property. | Land | Improvement |
|---|---|---|---|---|
| 2025 | $6,632 | $606,669 | $193,614 | $413,055 |
| 2023 | $6,632 | $583,113 | $186,097 | $397,016 |
| 2022 | $6,422 | $571,681 | $182,449 | $389,232 |
| 2021 | $6,294 | $560,472 | $178,872 | $381,600 |
| 2020 | $6,225 | $554,726 | $177,038 | $377,688 |
| 2019 | $6,080 | $543,850 | $173,567 | $370,283 |
| 2018 | $5,942 | $533,187 | $170,164 | $363,023 |
| 2017 | $5,794 | $522,733 | $166,828 | $355,905 |
| 2016 | $5,738 | $512,484 | $163,557 | $348,927 |
| 2015 | $5,612 | $504,788 | $161,101 | $343,687 |
| 2014 | $5,263 | $482,000 | $154,000 | $328,000 |
Source: Public Records
Map
Nearby Homes
- 3243 Temescal Ave
- 1042 Frontier Rd
- 891 La Quinta Way
- 640 Vaughan St
- 1090 4th St
- 3004 Dapplegray Ln
- 887 Kingman Dr
- 3470 Pedley Ave
- 3757 Corona Ave
- 871 Hillside Ln
- 3563 Pedley Ave
- 3580 Valley View Ave
- 866 Sixth St
- 1041 Lori Ct
- 1100 6th St
- 3149 Sierra Ave
- 4077 Temescal Ave
- 3700 California Ave
- 989 3rd St
- 2633 Valley View Ave
- 3257 Temescal Ave
- 3185 Temescal Ave
- 3192 Temescal Ave
- 3171 Temescal Ave
- 3260 Temescal Ave
- 3182 Temescal Ave
- 3279 Temescal Ave
- 3172 Temescal Ave
- 3278 Temescal Ave
- 3290 Temescal Ave
- 3220 Temescal Ave
- 921 Cole St
- 3161 Temescal Ave
- 3141 Temescal Ave
- 3307 Temescal Ave Unit 8
- 941 Cole St
- 3293 Temescal Ave
- 3244 Temescal Ave
- 3331 Temescal Ave
- 3138 Temescal Ave
Your Personal Tour Guide
Ask me questions while you tour the home.