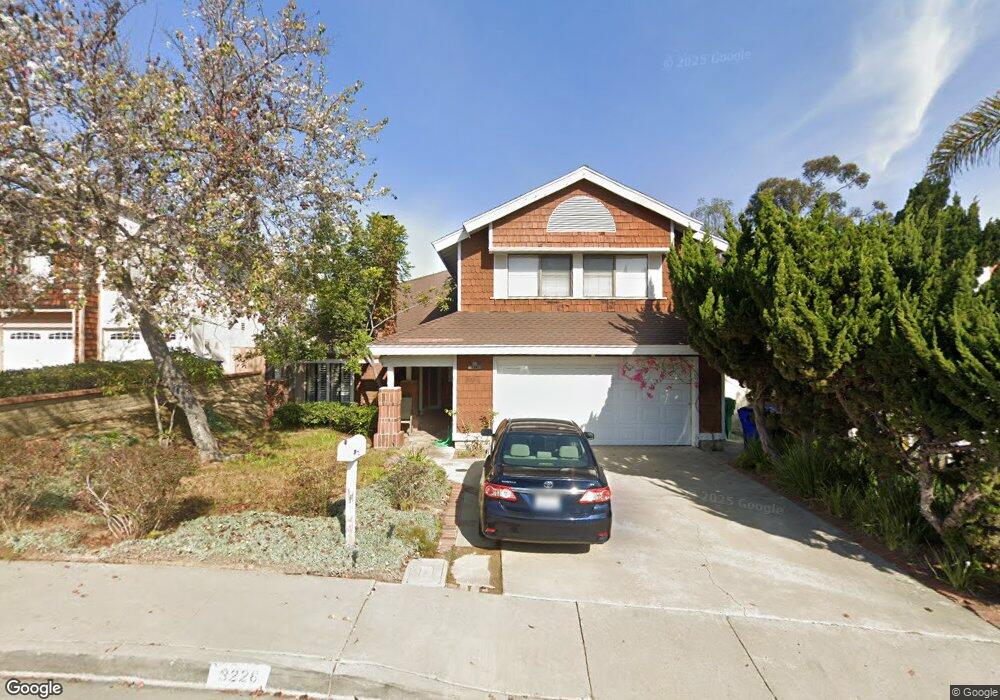
3226 Millikin Ave San Diego, CA 92122
University City NeighborhoodEstimated Value: $1,806,584 - $2,224,000
4
Beds
3
Baths
2,546
Sq Ft
$779/Sq Ft
Est. Value
About This Home
This home is located at 3226 Millikin Ave, San Diego, CA 92122 and is currently estimated at $1,983,146, approximately $778 per square foot. 3226 Millikin Ave is a home located in San Diego County with nearby schools including Spreckels Elementary School, Standley Middle School, and University City High School.
Ownership History
Date
Name
Owned For
Owner Type
Purchase Details
Closed on
Oct 21, 2005
Sold by
Malek Ali
Bought by
Malek Ali
Current Estimated Value
Purchase Details
Closed on
Jan 24, 2003
Sold by
Walker Stephen J and Walker Jessica W
Bought by
Malek Ali
Home Financials for this Owner
Home Financials are based on the most recent Mortgage that was taken out on this home.
Original Mortgage
$540,000
Outstanding Balance
$228,858
Interest Rate
5.93%
Estimated Equity
$1,754,288
Purchase Details
Closed on
Oct 26, 2000
Sold by
Homa Z Mwns & Sorooshian Mehrbanou Jamshidia and Zartoshty Homa
Bought by
Walker Stephen J and Walker Jessica W
Home Financials for this Owner
Home Financials are based on the most recent Mortgage that was taken out on this home.
Original Mortgage
$447,200
Interest Rate
8%
Purchase Details
Closed on
Dec 20, 1993
Sold by
Jamshidian Vida Zartoshty
Bought by
Jamshidian Jamshid and Jamshidian Vida
Create a Home Valuation Report for This Property
The Home Valuation Report is an in-depth analysis detailing your home's value as well as a comparison with similar homes in the area
Home Values in the Area
Average Home Value in this Area
Purchase History
| Date | Buyer | Sale Price | Title Company |
|---|---|---|---|
| Malek Ali | -- | -- | |
| Malek Ali | $675,000 | Equity Title Company | |
| Walker Stephen J | $559,000 | Fidelity National Title | |
| Jamshidian Jamshid | -- | -- |
Source: Public Records
Mortgage History
| Date | Status | Borrower | Loan Amount |
|---|---|---|---|
| Open | Malek Ali | $540,000 | |
| Previous Owner | Walker Stephen J | $447,200 | |
| Closed | Walker Stephen J | $27,900 |
Source: Public Records
Tax History Compared to Growth
Tax History
| Year | Tax Paid | Tax Assessment Tax Assessment Total Assessment is a certain percentage of the fair market value that is determined by local assessors to be the total taxable value of land and additions on the property. | Land | Improvement |
|---|---|---|---|---|
| 2025 | $11,805 | $977,606 | $506,908 | $470,698 |
| 2024 | $11,805 | $958,438 | $496,969 | $461,469 |
| 2023 | $11,545 | $939,646 | $487,225 | $452,421 |
| 2022 | $11,238 | $921,222 | $477,672 | $443,550 |
| 2021 | $11,161 | $903,159 | $468,306 | $434,853 |
| 2020 | $11,026 | $893,900 | $463,505 | $430,395 |
| 2019 | $10,830 | $876,373 | $454,417 | $421,956 |
| 2018 | $10,125 | $859,190 | $445,507 | $413,683 |
| 2017 | $81 | $842,344 | $436,772 | $405,572 |
| 2016 | $9,727 | $825,828 | $428,208 | $397,620 |
| 2015 | $9,584 | $813,424 | $421,776 | $391,648 |
| 2014 | $9,433 | $797,491 | $413,514 | $383,977 |
Source: Public Records
Map
Nearby Homes
- 3426 Millikin Ave
- 6036 Tulane St
- 3542 Governor Dr
- 3003 Fried Ave
- 6614 Dennison St
- 7849 Camino Glorita
- 2925 Fried Ave
- 3941 Camino Lindo
- 3965 Camino Lindo Unit 194
- 3736 Millikin Ave
- 7833 Camino Huerta
- 7825 Camino Tranquilo Unit 26
- 7837 Camino Tranquilo
- 5822 Stadium St
- 6547 Radcliffe Dr
- 6174 Syracuse Way
- 7975 Playmor Terrace
- 7915 Camino Kiosco
- 4145 Porte de Merano Unit 128
- 8090 Camino Kiosco
- 3238 Millikin Ave
- 3214 Millikin Ave
- 3250 Millikin Ave
- 3225 Millikin Ave
- 3262 Millikin Ave
- 3255 Millikin Ave
- 3274 Millikin Ave
- 3225 Willard St
- 3286 Millikin Ave
- 6259 Buisson St
- 6267 Buisson St
- 6251 Buisson St
- 3235 Willard St
- 3246 Willard St
- 3298 Millikin Ave
- 3263 Lahitte Ct
- 6275 Buisson St
- 3266 Willard St
- 3310 Millikin Ave
- 3245 Willard St