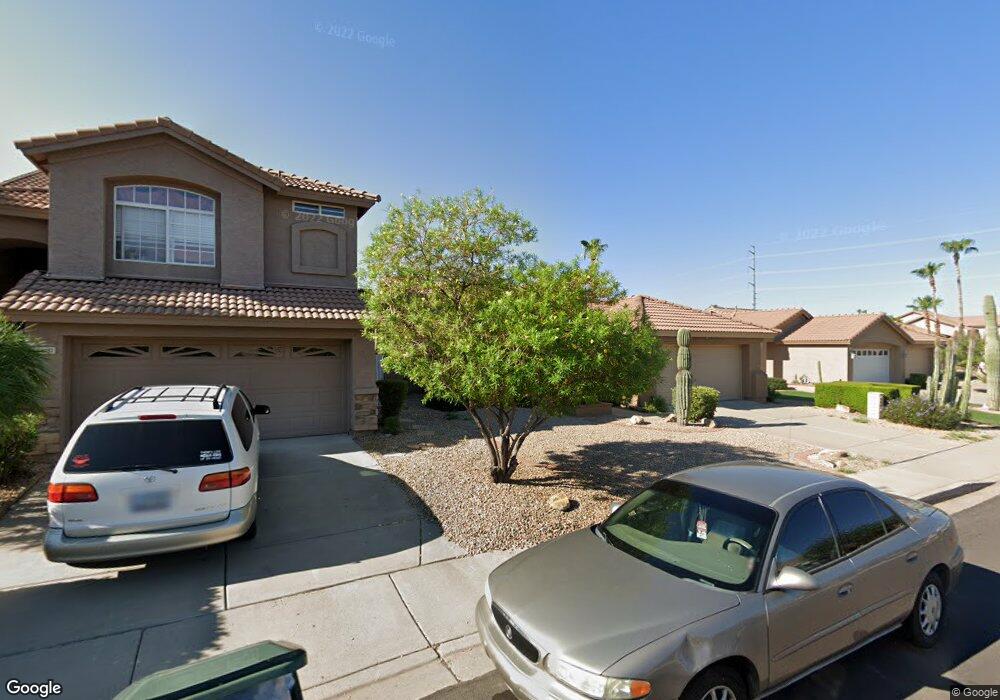
3227 E Behrend Dr Phoenix, AZ 85050
Paradise Valley Village NeighborhoodEstimated Value: $492,000 - $522,000
3
Beds
2
Baths
1,554
Sq Ft
$325/Sq Ft
Est. Value
About This Home
This home is located at 3227 E Behrend Dr, Phoenix, AZ 85050 and is currently estimated at $505,071, approximately $325 per square foot. 3227 E Behrend Dr is a home located in Maricopa County with nearby schools including Quail Run Elementary School, Sunrise Middle School, and Paradise Valley High School.
Ownership History
Date
Name
Owned For
Owner Type
Purchase Details
Closed on
Nov 9, 2011
Sold by
Lemau Janice E
Bought by
Keatch Ronald G and Keatch Janice
Current Estimated Value
Purchase Details
Closed on
Mar 12, 2003
Sold by
Rader Douglas
Bought by
Lemau Janice E
Home Financials for this Owner
Home Financials are based on the most recent Mortgage that was taken out on this home.
Original Mortgage
$138,000
Interest Rate
5.79%
Mortgage Type
New Conventional
Purchase Details
Closed on
Oct 1, 2001
Sold by
Bryk Frank A and Bryk Margaret E
Bought by
Scott Florence R
Purchase Details
Closed on
Oct 20, 1995
Sold by
Richmond American Homes Inc
Bought by
Bryk Frank A and Bryk Margaret E
Home Financials for this Owner
Home Financials are based on the most recent Mortgage that was taken out on this home.
Original Mortgage
$120,500
Interest Rate
7.59%
Create a Home Valuation Report for This Property
The Home Valuation Report is an in-depth analysis detailing your home's value as well as a comparison with similar homes in the area
Home Values in the Area
Average Home Value in this Area
Purchase History
| Date | Buyer | Sale Price | Title Company |
|---|---|---|---|
| Keatch Ronald G | $150,000 | American Title Service Agenc | |
| Lemau Janice E | $172,500 | Old Republic Title Agency | |
| Scott Florence R | $159,000 | North American Title Agency | |
| Bryk Frank A | $134,044 | Old Republic Title Agency |
Source: Public Records
Mortgage History
| Date | Status | Borrower | Loan Amount |
|---|---|---|---|
| Previous Owner | Lemau Janice E | $138,000 | |
| Previous Owner | Bryk Frank A | $120,500 | |
| Closed | Keatch Ronald G | $0 |
Source: Public Records
Tax History
| Year | Tax Paid | Tax Assessment Tax Assessment Total Assessment is a certain percentage of the fair market value that is determined by local assessors to be the total taxable value of land and additions on the property. | Land | Improvement |
|---|---|---|---|---|
| 2025 | $2,119 | $24,475 | -- | -- |
| 2024 | $2,018 | $23,309 | -- | -- |
| 2023 | $2,018 | $36,900 | $7,380 | $29,520 |
| 2022 | $1,999 | $28,050 | $5,610 | $22,440 |
| 2021 | $2,032 | $26,210 | $5,240 | $20,970 |
| 2020 | $1,962 | $24,870 | $4,970 | $19,900 |
| 2019 | $1,971 | $23,220 | $4,640 | $18,580 |
| 2018 | $1,900 | $20,960 | $4,190 | $16,770 |
| 2017 | $1,814 | $19,930 | $3,980 | $15,950 |
| 2016 | $1,785 | $19,460 | $3,890 | $15,570 |
| 2015 | $1,656 | $17,650 | $3,530 | $14,120 |
Source: Public Records
Map
Nearby Homes
- 3212 E Tonto Ln
- 20007 N 33rd St
- 19802 N 32nd St Unit 142
- 19802 N 32nd St Unit 144
- 19802 N 32nd St Unit 169
- 19802 N 32nd St Unit 65
- 19802 N 32nd St Unit 73
- 3239 E Sequoia Dr
- 3154 E Wahalla Ln
- 19602 N 32nd St Unit 129
- 19602 N 32nd St Unit 125
- 19602 N 32nd St Unit 32
- 19602 N 32nd St Unit 6
- 3206 E Kristal Way
- 3407 E Escuda Rd
- 3114 E Kristal Way
- 3401 E Menadota Dr
- 3021 E Wahalla Ln
- 3150 E Beardsley Rd Unit 1055
- 3150 E Beardsley Rd Unit 1045
- 3231 E Behrend Dr
- 3223 E Behrend Dr
- 3219 E Behrend Dr
- 3235 E Behrend Dr
- 3228 E Tonto Ln
- 3232 E Tonto Ln
- 3224 E Tonto Ln
- 3239 E Behrend Dr
- 3220 E Tonto Ln
- 3234 R E Behrend Dr
- 3234 E Behrend Dr
- 3230 E Behrend Dr
- 19635 N 33rd St
- 3226 E Behrend Dr
- 19803 N 33rd St
- 3215 E Behrend Dr
- 3222 E Behrend Dr
- 3301 E Behrend Dr
- 3216 E Tonto Ln
- 19807 N 33rd St
Your Personal Tour Guide
Ask me questions while you tour the home.