Estimated Value: $381,581 - $404,000
3
Beds
2
Baths
1,592
Sq Ft
$246/Sq Ft
Est. Value
About This Home
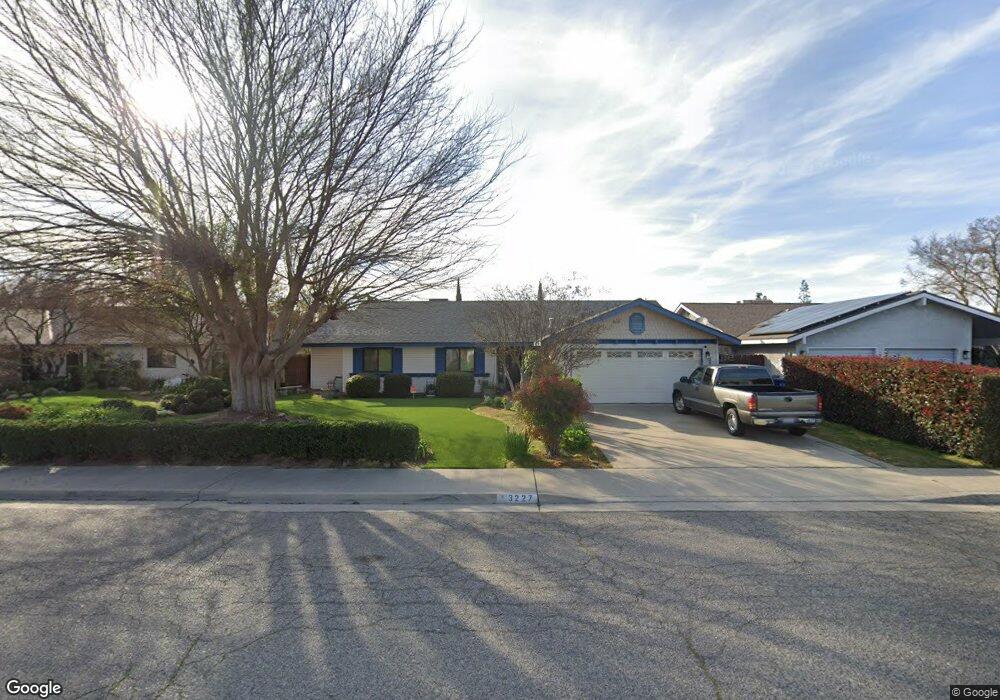
This home is located at 3227 Love St, Selma, CA 93662 and is currently estimated at $392,145, approximately $246 per square foot. 3227 Love St is a home located in Fresno County with nearby schools including Theodore Roosevelt Elementary School, Abraham Lincoln Middle School, and Selma High School.
Ownership History
Date
Name
Owned For
Owner Type
Purchase Details
Closed on
Jan 15, 2004
Sold by
Grindle Robert V and Grindle Sylvia L
Bought by
Grindle Robert and Grindle Sylvia L
Current Estimated Value
Purchase Details
Closed on
Jul 27, 1998
Sold by
Dept Of Vet Affairs
Bought by
Grindle Robert and Grindle Sylvia L
Home Financials for this Owner
Home Financials are based on the most recent Mortgage that was taken out on this home.
Original Mortgage
$86,000
Outstanding Balance
$17,879
Interest Rate
6.88%
Estimated Equity
$374,266
Create a Home Valuation Report for This Property
The Home Valuation Report is an in-depth analysis detailing your home's value as well as a comparison with similar homes in the area
Home Values in the Area
Average Home Value in this Area
Purchase History
| Date | Buyer | Sale Price | Title Company |
|---|---|---|---|
| Grindle Robert | -- | -- | |
| Grindle Robert | -- | Chicago Title Co |
Source: Public Records
Mortgage History
| Date | Status | Borrower | Loan Amount |
|---|---|---|---|
| Open | Grindle Robert | $86,000 |
Source: Public Records
Tax History Compared to Growth
Tax History
| Year | Tax Paid | Tax Assessment Tax Assessment Total Assessment is a certain percentage of the fair market value that is determined by local assessors to be the total taxable value of land and additions on the property. | Land | Improvement |
|---|---|---|---|---|
| 2025 | $2,880 | $172,517 | $39,030 | $133,487 |
| 2023 | $2,433 | $165,819 | $37,515 | $128,304 |
| 2022 | $2,717 | $162,569 | $36,780 | $125,789 |
| 2021 | $2,649 | $159,382 | $36,059 | $123,323 |
| 2020 | $2,618 | $157,749 | $35,690 | $122,059 |
| 2019 | $2,544 | $154,657 | $34,991 | $119,666 |
| 2018 | $2,482 | $151,625 | $34,305 | $117,320 |
| 2017 | $2,399 | $148,653 | $33,633 | $115,020 |
| 2016 | $2,170 | $145,739 | $32,974 | $112,765 |
| 2015 | $2,200 | $143,551 | $32,479 | $111,072 |
| 2014 | $2,151 | $140,740 | $31,843 | $108,897 |
Source: Public Records
Map
Nearby Homes