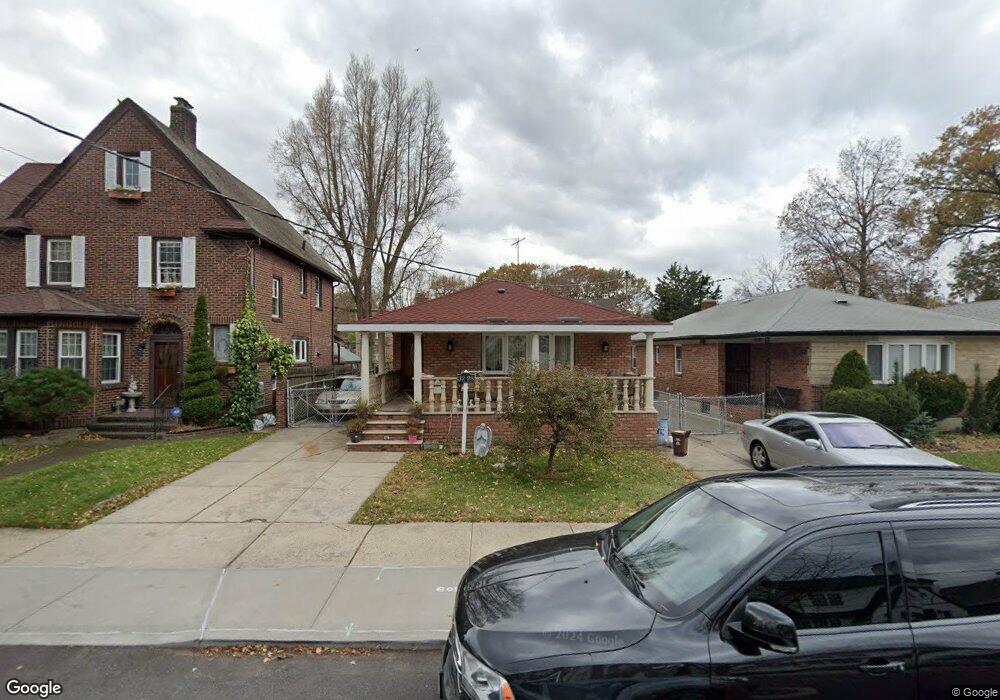
3228 166th St Flushing, NY 11358
Murray Hill-Broadway NeighborhoodEstimated Value: $1,064,000 - $1,197,000
Studio
--
Bath
1,198
Sq Ft
$932/Sq Ft
Est. Value
About This Home
This home is located at 3228 166th St, Flushing, NY 11358 and is currently estimated at $1,116,505, approximately $931 per square foot. 3228 166th St is a home located in Queens County with nearby schools including P.S. 32 - State Street, I.S. 25 Adrien Block, and Francis Lewis High School.
Ownership History
Date
Name
Owned For
Owner Type
Purchase Details
Closed on
Jan 31, 2005
Sold by
Simon Valerie
Bought by
Simon Ecliffe and Simon Valerie
Current Estimated Value
Purchase Details
Closed on
Jul 30, 2001
Sold by
Canada Donna and Buckley Stella M L
Bought by
Aguilar Elia
Home Financials for this Owner
Home Financials are based on the most recent Mortgage that was taken out on this home.
Original Mortgage
$265,600
Interest Rate
6.85%
Create a Home Valuation Report for This Property
The Home Valuation Report is an in-depth analysis detailing your home's value as well as a comparison with similar homes in the area
Home Values in the Area
Average Home Value in this Area
Purchase History
| Date | Buyer | Sale Price | Title Company |
|---|---|---|---|
| Simon Ecliffe | -- | -- | |
| Simon Ecliffe | -- | -- | |
| Aguilar Elia | -- | -- | |
| Aguilar Elia | -- | -- |
Source: Public Records
Mortgage History
| Date | Status | Borrower | Loan Amount |
|---|---|---|---|
| Previous Owner | Aguilar Elia | $265,600 | |
| Closed | Simon Ecliffe | $0 |
Source: Public Records
Tax History
| Year | Tax Paid | Tax Assessment Tax Assessment Total Assessment is a certain percentage of the fair market value that is determined by local assessors to be the total taxable value of land and additions on the property. | Land | Improvement |
|---|---|---|---|---|
| 2025 | $10,252 | $54,462 | $15,031 | $39,431 |
| 2024 | $10,264 | $52,445 | $14,857 | $37,588 |
| 2023 | $9,750 | $49,943 | $14,283 | $35,660 |
| 2022 | $8,639 | $53,160 | $18,000 | $35,160 |
| 2021 | $9,255 | $55,980 | $18,000 | $37,980 |
| 2020 | $9,311 | $61,560 | $18,000 | $43,560 |
| 2019 | $8,850 | $60,360 | $18,000 | $42,360 |
| 2018 | $8,186 | $41,619 | $14,335 | $27,284 |
| 2017 | $7,704 | $39,264 | $14,107 | $25,157 |
| 2016 | $7,251 | $39,264 | $14,107 | $25,157 |
| 2015 | $4,248 | $37,821 | $17,941 | $19,880 |
| 2014 | $4,248 | $36,420 | $19,980 | $16,440 |
Source: Public Records
Map
Nearby Homes
Your Personal Tour Guide
Ask me questions while you tour the home.