323 Allen Dr Cookeville, TN 38501
Dodson Branch NeighborhoodEstimated Value: $220,811 - $343,000
--
Bed
1
Bath
1,200
Sq Ft
$250/Sq Ft
Est. Value
About This Home
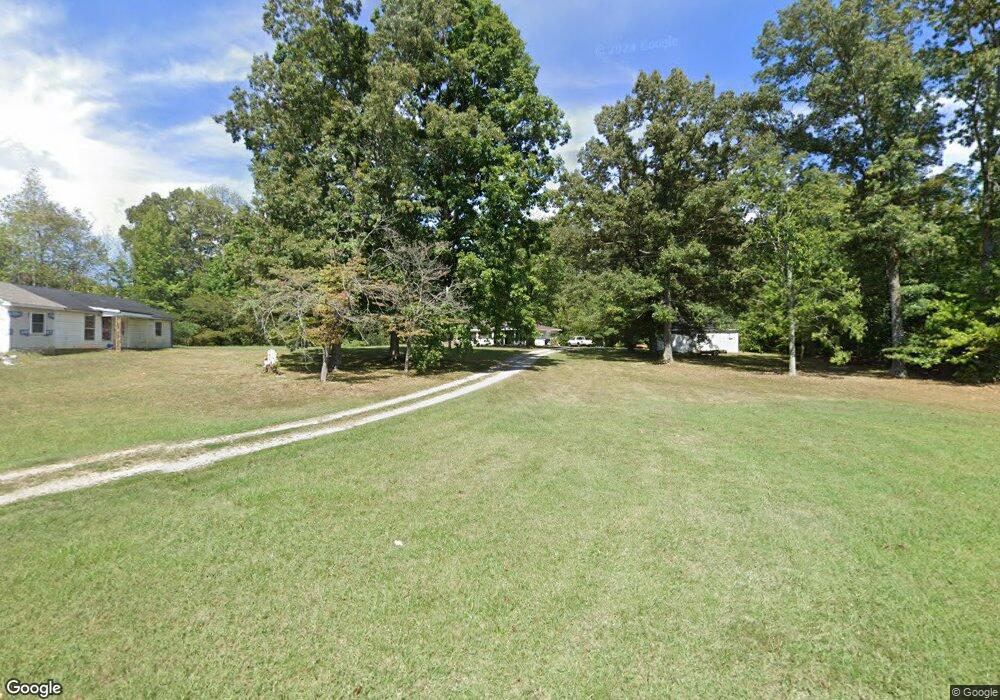
This home is located at 323 Allen Dr, Cookeville, TN 38501 and is currently estimated at $299,953, approximately $249 per square foot. 323 Allen Dr is a home located in Jackson County with nearby schools including Jackson County High School.
Ownership History
Date
Name
Owned For
Owner Type
Purchase Details
Closed on
Sep 19, 2025
Sold by
Hawkins Robin Denise and Diane Mayberry Steel Shelia
Bought by
Hawkins Robin Denise and Steel Shelia Diane
Current Estimated Value
Purchase Details
Closed on
Sep 14, 2025
Sold by
Mayberry Charles Richard
Bought by
Hawkins Robin Denise and Steel Shelia Diane
Purchase Details
Closed on
Mar 26, 2022
Sold by
Mayberry Charles Richard and Diane Mayberry Steel Shelia
Bought by
Mayberry Charles Richard and Steel Shelia Diane
Purchase Details
Closed on
May 15, 2012
Sold by
Mayberry Charles E
Bought by
Mayberry Charles Richard and Steel Shelia Diane Mayberry
Purchase Details
Closed on
Oct 23, 1975
Bought by
Mayberry Charles E and Mayberry Delma
Purchase Details
Closed on
May 7, 1970
Create a Home Valuation Report for This Property
The Home Valuation Report is an in-depth analysis detailing your home's value as well as a comparison with similar homes in the area
Home Values in the Area
Average Home Value in this Area
Purchase History
| Date | Buyer | Sale Price | Title Company |
|---|---|---|---|
| Hawkins Robin Denise | -- | None Listed On Document | |
| Wylie Seth Michael | -- | None Listed On Document | |
| Hawkins Robin Denise | -- | None Listed On Document | |
| Mayberry Charles Richard | -- | None Listed On Document | |
| Mayberry Charles Richard | -- | None Listed On Document | |
| Mayberry Charles Richard | -- | -- | |
| Mayberry Charles E | -- | -- | |
| -- | -- | -- |
Source: Public Records
Tax History Compared to Growth
Tax History
| Year | Tax Paid | Tax Assessment Tax Assessment Total Assessment is a certain percentage of the fair market value that is determined by local assessors to be the total taxable value of land and additions on the property. | Land | Improvement |
|---|---|---|---|---|
| 2024 | $902 | $35,375 | $9,000 | $26,375 |
| 2023 | $902 | $35,375 | $9,000 | $26,375 |
| 2022 | $795 | $35,375 | $9,000 | $26,375 |
| 2021 | $795 | $35,375 | $9,000 | $26,375 |
| 2020 | $783 | $35,375 | $9,000 | $26,375 |
| 2019 | $783 | $28,050 | $7,475 | $20,575 |
| 2018 | $783 | $28,050 | $7,475 | $20,575 |
| 2017 | $783 | $28,050 | $7,475 | $20,575 |
| 2016 | $783 | $28,050 | $7,475 | $20,575 |
| 2015 | $799 | $28,050 | $7,475 | $20,575 |
| 2014 | $893 | $31,350 | $7,850 | $23,500 |
Source: Public Records
Map
Nearby Homes