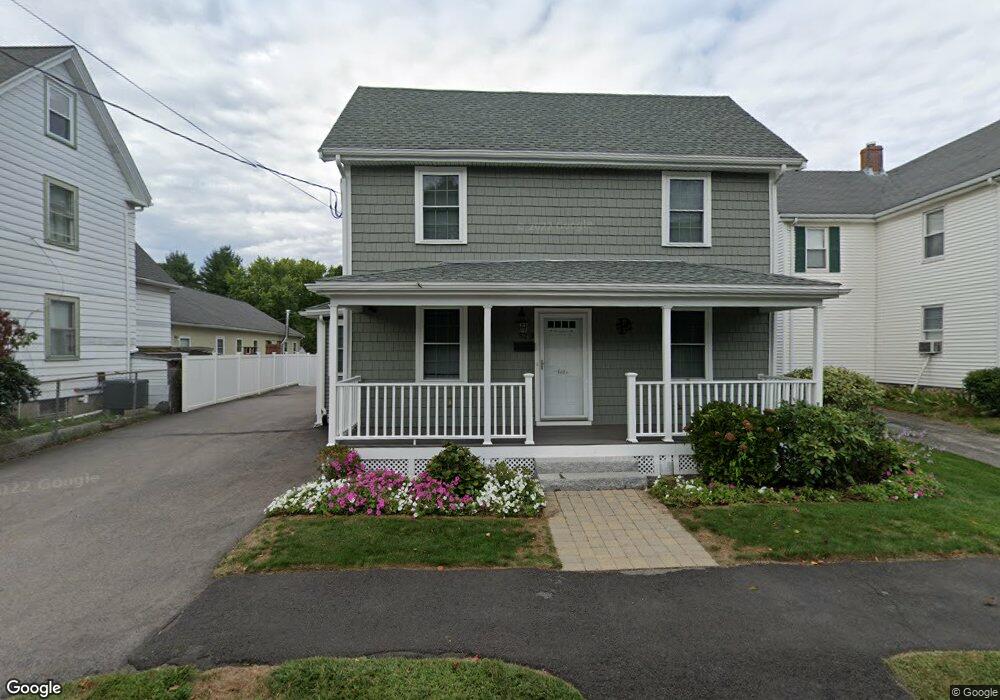
323 Cherry St West Newton, MA 02465
West Newton NeighborhoodEstimated Value: $1,079,000 - $1,676,000
4
Beds
3
Baths
2,531
Sq Ft
$552/Sq Ft
Est. Value
About This Home
This home is located at 323 Cherry St, West Newton, MA 02465 and is currently estimated at $1,396,808, approximately $551 per square foot. 323 Cherry St is a home located in Middlesex County with nearby schools including Franklin Elementary School, C.C. Burr, and F.A. Day Middle School.
Ownership History
Date
Name
Owned For
Owner Type
Purchase Details
Closed on
Sep 26, 2017
Sold by
Perri Vincenzo
Bought by
Vincenzo & Lisa Perri Ft
Current Estimated Value
Purchase Details
Closed on
Feb 24, 2014
Sold by
Toli Richard V and Toli Laura
Bought by
Perri Vincenzo
Home Financials for this Owner
Home Financials are based on the most recent Mortgage that was taken out on this home.
Original Mortgage
$400,000
Interest Rate
4.5%
Mortgage Type
New Conventional
Purchase Details
Closed on
May 13, 2002
Sold by
Meleedy Paul C and Meleedy Mary L
Bought by
Toli Richard and Morrissey Newtlaura
Home Financials for this Owner
Home Financials are based on the most recent Mortgage that was taken out on this home.
Original Mortgage
$270,000
Interest Rate
7.18%
Mortgage Type
Purchase Money Mortgage
Create a Home Valuation Report for This Property
The Home Valuation Report is an in-depth analysis detailing your home's value as well as a comparison with similar homes in the area
Home Values in the Area
Average Home Value in this Area
Purchase History
| Date | Buyer | Sale Price | Title Company |
|---|---|---|---|
| Vincenzo & Lisa Perri Ft | -- | -- | |
| Perri Vincenzo | $550,000 | -- | |
| Toli Richard | $350,000 | -- |
Source: Public Records
Mortgage History
| Date | Status | Borrower | Loan Amount |
|---|---|---|---|
| Previous Owner | Perri Vincenzo | $400,000 | |
| Previous Owner | Toli Richard | $270,000 |
Source: Public Records
Tax History
| Year | Tax Paid | Tax Assessment Tax Assessment Total Assessment is a certain percentage of the fair market value that is determined by local assessors to be the total taxable value of land and additions on the property. | Land | Improvement |
|---|---|---|---|---|
| 2025 | $11,653 | $1,189,100 | $845,100 | $344,000 |
| 2024 | $11,268 | $1,154,500 | $820,500 | $334,000 |
| 2023 | $10,729 | $1,053,900 | $636,100 | $417,800 |
| 2022 | $10,265 | $975,800 | $589,000 | $386,800 |
| 2021 | $9,906 | $920,600 | $555,700 | $364,900 |
| 2020 | $9,611 | $920,600 | $555,700 | $364,900 |
| 2019 | $9,340 | $893,800 | $539,500 | $354,300 |
| 2018 | $8,944 | $826,600 | $484,800 | $341,800 |
| 2017 | $8,671 | $779,800 | $457,400 | $322,400 |
| 2016 | $8,294 | $728,800 | $427,500 | $301,300 |
| 2015 | $5,655 | $487,100 | $399,500 | $87,600 |
Source: Public Records
Map
Nearby Homes
- 383 Cherry St Unit 383
- 6 Elm St Unit 6
- 16 Elm St Unit 16
- 2 Elm St Unit 2
- 106 River St Unit 18
- 8 Elm St Unit 8
- 14 Cottage Place Unit 14
- 287 Cherry St Unit 1
- 60 Lindbergh Ave
- 24 Mague Ave Unit 24
- 90 Auburndale Ave
- 14 Wedgewood Rd
- 105 Adams Ave
- 38 Barbara Rd
- 88 Warwick Rd Unit 1
- 0 Duncan Rd Unit 72925240
- 54 Temple St
- 29 Parsons St
- 40 Greenwood Ave
- 160 Pine St Unit 15
- 319 Cherry St
- 327 Cherry St
- 327 Cherry St Unit R
- 315 Cherry St
- 328 Cherry St Unit 2
- 328 Cherry St Unit 1
- 318 Cherry St Unit 320
- 332 Cherry St
- 309 Cherry St
- 326 Cherry St Unit 2
- 326 Cherry St Unit 1
- 333 Cherry St Unit 1
- 333 Cherry St Unit 2
- 333 Cherry St
- 7 Raymond Place
- 10 Henshaw St
- 5 Henshaw St
- 312 Cherry St
- 312 Cherry St
- 312 Cherry St Unit 2
Your Personal Tour Guide
Ask me questions while you tour the home.