323 Clay St Colusa, CA 95932
Estimated Value: $249,827 - $356,000
3
Beds
1
Bath
1,248
Sq Ft
$235/Sq Ft
Est. Value
About This Home
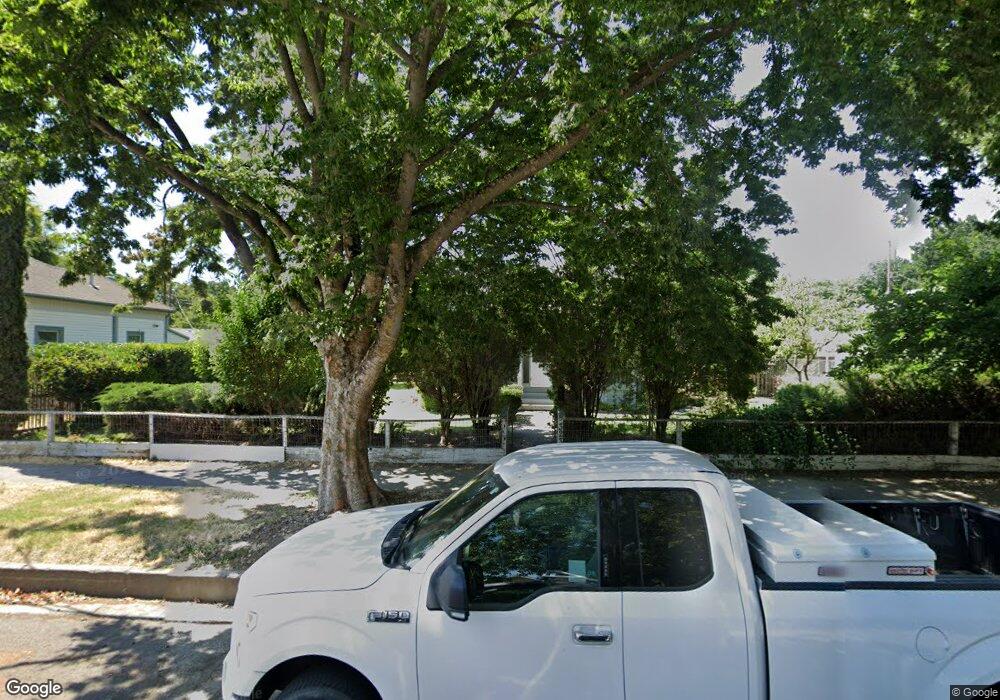
This home is located at 323 Clay St, Colusa, CA 95932 and is currently estimated at $292,957, approximately $234 per square foot. 323 Clay St is a home located in Colusa County with nearby schools including James M. Burchfield Primary School, George T. Egling Middle School, and Colusa High School.
Ownership History
Date
Name
Owned For
Owner Type
Purchase Details
Closed on
Aug 13, 2025
Sold by
Pedro Urionaguena Living Trust and Wayman Marie Gracie
Bought by
Wayman Marie Gracie
Current Estimated Value
Purchase Details
Closed on
Dec 22, 2011
Sold by
Urionaguena Pedro
Bought by
Urionaguena Pedro and The Pedro Urionaguena Living T
Purchase Details
Closed on
Jan 17, 2006
Sold by
Locvich Marie Gracie
Bought by
Urionaguena Pedro and Urionaguena Grace
Create a Home Valuation Report for This Property
The Home Valuation Report is an in-depth analysis detailing your home's value as well as a comparison with similar homes in the area
Home Values in the Area
Average Home Value in this Area
Purchase History
| Date | Buyer | Sale Price | Title Company |
|---|---|---|---|
| Wayman Marie Gracie | -- | None Listed On Document | |
| Urionaguena Pedro | -- | None Available | |
| Urionaguena Pedro | -- | None Available | |
| Urionaguena Pedro | -- | None Available |
Source: Public Records
Tax History
| Year | Tax Paid | Tax Assessment Tax Assessment Total Assessment is a certain percentage of the fair market value that is determined by local assessors to be the total taxable value of land and additions on the property. | Land | Improvement |
|---|---|---|---|---|
| 2025 | $407 | $29,324 | $12,217 | $17,107 |
| 2024 | $407 | $28,750 | $11,978 | $16,772 |
| 2023 | $372 | $28,188 | $11,744 | $16,444 |
| 2022 | $363 | $27,636 | $11,514 | $16,122 |
| 2021 | $346 | $27,095 | $11,289 | $15,806 |
| 2020 | $341 | $26,818 | $11,174 | $15,644 |
| 2019 | $342 | $26,293 | $10,955 | $15,338 |
| 2018 | $333 | $25,779 | $10,741 | $15,038 |
| 2017 | $335 | $25,275 | $10,531 | $14,744 |
| 2016 | $396 | $24,780 | $10,325 | $14,455 |
| 2015 | $387 | $24,408 | $10,170 | $14,238 |
| 2014 | $375 | $23,931 | $9,971 | $13,960 |
Source: Public Records
Map
Nearby Homes
- 35 Parkhill St
- 130 Fremont St
- 0 E Carson St Unit 225122408
- 738 Webster St
- 7300 Farinon Rd
- 731 Sioc St
- 0 Ware Ave
- 1425 5th St
- 616 12th St
- 0 14th St
- 1450 Lake Ave Unit 6
- 139 Country Club Dr
- 1771 Lurline Ave
- 23 Walnut Tree Dr
- 3488 River Rd
- 0 Niagara Ave
- 279 Piper Ln
- 276 Piper Ln
- 271 Piper Ln
- 284 Piper Ln
Your Personal Tour Guide
Ask me questions while you tour the home.