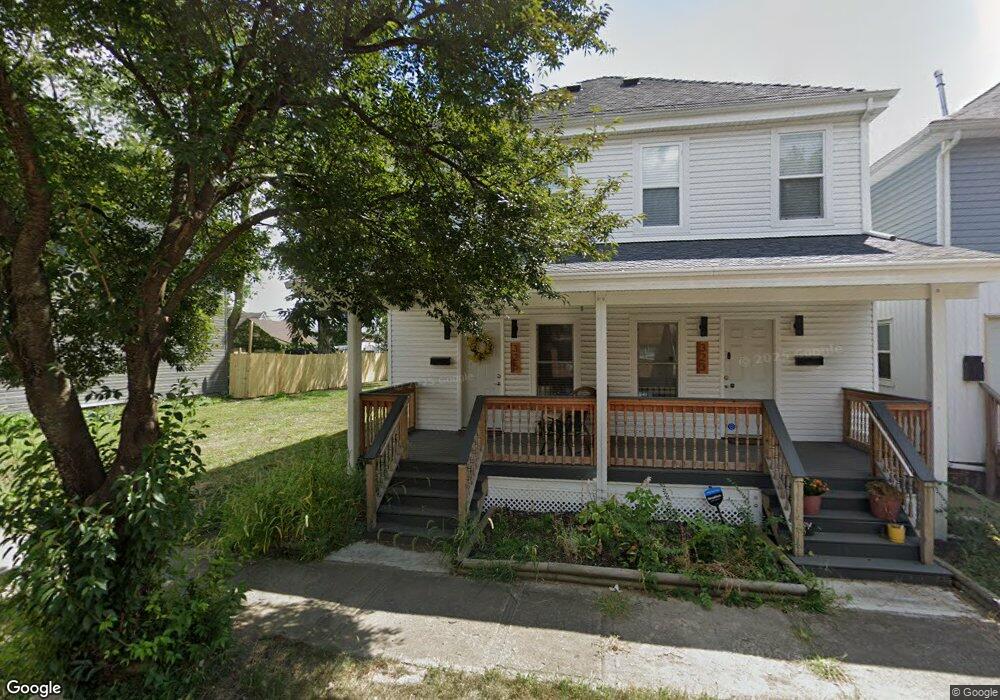
323 E Barthman Ave Unit 325 Columbus, OH 43207
Reeb-Hosack/Hungarian Village NeighborhoodEstimated Value: $187,000 - $232,000
5
Beds
2
Baths
2,016
Sq Ft
$106/Sq Ft
Est. Value
About This Home
This home is located at 323 E Barthman Ave Unit 325, Columbus, OH 43207 and is currently estimated at $212,849, approximately $105 per square foot. 323 E Barthman Ave Unit 325 is a home located in Franklin County with nearby schools including Southwood Elementary School, South High School, and South Columbus Preparatory Academy.
Ownership History
Date
Name
Owned For
Owner Type
Purchase Details
Closed on
Jan 2, 2023
Sold by
Rao Homes Llc
Bought by
Olson Seth
Current Estimated Value
Home Financials for this Owner
Home Financials are based on the most recent Mortgage that was taken out on this home.
Original Mortgage
$235,300
Outstanding Balance
$227,658
Interest Rate
6.33%
Mortgage Type
Credit Line Revolving
Estimated Equity
-$14,809
Purchase Details
Closed on
Dec 30, 2021
Sold by
Kegz Properties Llc
Bought by
Rao Homes Llc
Purchase Details
Closed on
Jun 26, 2019
Sold by
Payne Kathy D
Bought by
Kegz Properties Llc
Purchase Details
Closed on
Nov 23, 2007
Sold by
Luster David
Bought by
Payne Kathy D
Purchase Details
Closed on
Aug 15, 2007
Sold by
Estate Of Shirley A Luster
Bought by
Payne Kathy D and Luster David
Purchase Details
Closed on
Apr 1, 1991
Bought by
Luster Shirley A
Purchase Details
Closed on
Jun 1, 1985
Purchase Details
Closed on
Dec 1, 1984
Create a Home Valuation Report for This Property
The Home Valuation Report is an in-depth analysis detailing your home's value as well as a comparison with similar homes in the area
Home Values in the Area
Average Home Value in this Area
Purchase History
| Date | Buyer | Sale Price | Title Company |
|---|---|---|---|
| Olson Seth | -- | Americas Title Corp | |
| Rao Homes Llc | $83,000 | Valmer Land Title | |
| Kegz Properties Llc | $50,000 | Axxis Title Agency Ltd | |
| Payne Kathy D | -- | Attorney | |
| Payne Kathy D | -- | None Available | |
| Luster Shirley A | -- | -- | |
| -- | $2,000 | -- | |
| -- | -- | -- |
Source: Public Records
Mortgage History
| Date | Status | Borrower | Loan Amount |
|---|---|---|---|
| Open | Olson Seth | $235,300 |
Source: Public Records
Tax History Compared to Growth
Tax History
| Year | Tax Paid | Tax Assessment Tax Assessment Total Assessment is a certain percentage of the fair market value that is determined by local assessors to be the total taxable value of land and additions on the property. | Land | Improvement |
|---|---|---|---|---|
| 2024 | $3,033 | $66,190 | $15,930 | $50,260 |
| 2023 | $3,043 | $66,190 | $15,930 | $50,260 |
| 2022 | $874 | $15,720 | $3,960 | $11,760 |
| 2021 | $879 | $15,720 | $3,960 | $11,760 |
| 2020 | $1,358 | $15,720 | $3,960 | $11,760 |
| 2019 | $825 | $13,270 | $3,610 | $9,660 |
| 2018 | $412 | $13,270 | $3,610 | $9,660 |
| 2017 | $933 | $13,270 | $3,610 | $9,660 |
| 2016 | $1,041 | $15,330 | $3,010 | $12,320 |
| 2015 | $474 | $15,330 | $3,010 | $12,320 |
| 2014 | $951 | $15,330 | $3,010 | $12,320 |
| 2013 | $575 | $16,100 | $3,150 | $12,950 |
Source: Public Records
Map
Nearby Homes
- 319 E Barthman Ave
- 292 E Barthman Ave
- 308 Hosack St
- 238 E Barthman Ave
- 259 Hinkle Ave
- 1808 S 6th St Unit 810
- 160 E Barthman Ave
- 1756 Bruck St
- 255 E Woodrow Ave
- 314 E Woodrow Ave
- 457 E Woodrow Ave Unit 459
- 332 E Hinman Ave
- 1696 Parsons Ave
- 1692 Parsons Ave
- 92 E Innis Ave
- 464 E Hinman Ave
- 472 E Hinman Ave
- 1676 Parsons Ave
- 59 E Innis Ave
- 129 E Hinman Ave
- 323-325 E Barthman Ave
- 0 E Barthman Ave
- 317 E Barthman Ave Unit 319
- 313 E Barthman Ave Unit 315
- 333 E Barthman Ave
- 1934 S 9th St
- 337 E Barthman Ave
- 1938 S 9th St
- 328 E Barthman Ave
- 341 E Barthman Ave
- 308 E Barthman Ave
- 1946 S 9th St
- 326 E Barthman Ave Unit 328
- 1945 S Washington Ave
- 330 E Barthman Ave Unit 332
- 1935 S 9th St
- 1949 S Washington Ave
- 1956 S 9th St
- 1896 S Washington Ave Unit DRY
- 291 E Barthman Ave