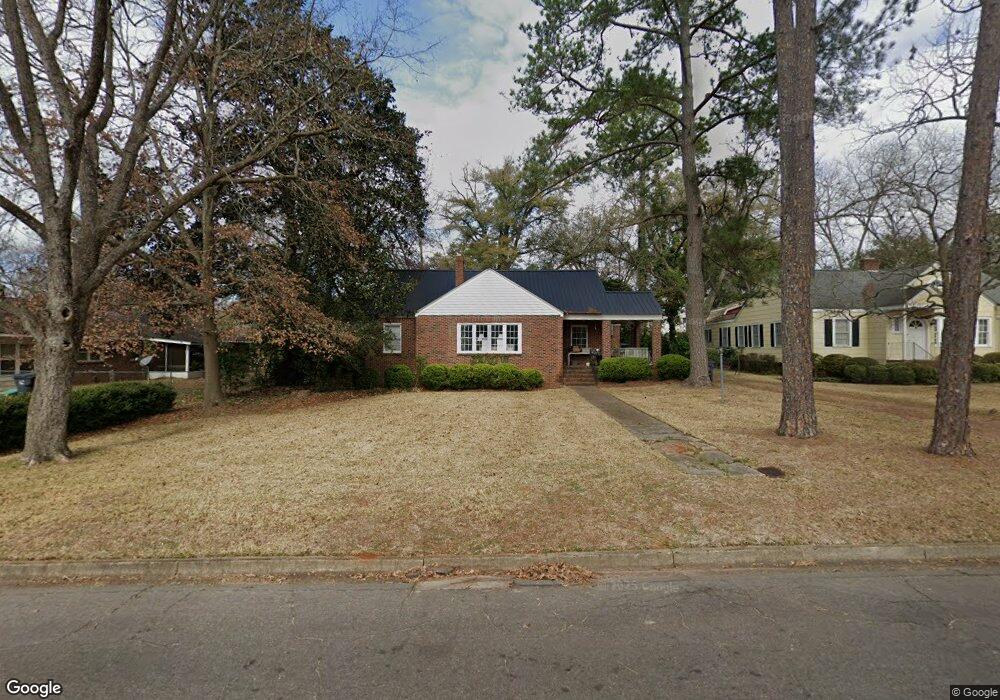
323 Pecan Dr Americus, GA 31709
Estimated Value: $114,000 - $160,000
3
Beds
1
Bath
1,464
Sq Ft
$94/Sq Ft
Est. Value
About This Home
This home is located at 323 Pecan Dr, Americus, GA 31709 and is currently estimated at $138,242, approximately $94 per square foot. 323 Pecan Dr is a home located in Sumter County with nearby schools including Sumter County Primary School, Sumter County Elementary School, and Sumter County Middle School.
Ownership History
Date
Name
Owned For
Owner Type
Purchase Details
Closed on
Jan 26, 2016
Sold by
Bank Of America
Bought by
Henderson Hope E
Current Estimated Value
Purchase Details
Closed on
Nov 3, 2015
Sold by
Shufflebarger Mitzi A
Bought by
Bank Of America
Purchase Details
Closed on
Sep 5, 2014
Sold by
Shufflebarger Mitzi A
Bought by
Shufflebarger Mitzi A
Purchase Details
Closed on
Oct 30, 2002
Sold by
Derosia Gary R
Bought by
Shufflebarger Mitza A
Purchase Details
Closed on
Apr 13, 2001
Sold by
Farr Paul O
Bought by
Derosia Gary R
Purchase Details
Closed on
Aug 24, 1997
Sold by
Farr Paul O and Farr Holli
Bought by
Farr Paul O
Purchase Details
Closed on
Feb 28, 1997
Sold by
Simmons Samuel K
Bought by
Farr Paul O and Farr Holli
Purchase Details
Closed on
Sep 29, 1993
Sold by
Comer Oscar
Bought by
Simmons Samuel K
Purchase Details
Closed on
Sep 23, 1992
Sold by
Comer Bertha
Bought by
Comer Oscar
Create a Home Valuation Report for This Property
The Home Valuation Report is an in-depth analysis detailing your home's value as well as a comparison with similar homes in the area
Home Values in the Area
Average Home Value in this Area
Purchase History
| Date | Buyer | Sale Price | Title Company |
|---|---|---|---|
| Henderson Hope E | $50,000 | -- | |
| Bank Of America | $40,101 | -- | |
| Shufflebarger Mitzi A | -- | -- | |
| Shufflebarger Mitza A | $91,000 | -- | |
| Derosia Gary R | $76,000 | -- | |
| Farr Paul O | -- | -- | |
| Farr Paul O | $67,500 | -- | |
| Simmons Samuel K | $60,000 | -- | |
| Comer Oscar | -- | -- |
Source: Public Records
Tax History Compared to Growth
Tax History
| Year | Tax Paid | Tax Assessment Tax Assessment Total Assessment is a certain percentage of the fair market value that is determined by local assessors to be the total taxable value of land and additions on the property. | Land | Improvement |
|---|---|---|---|---|
| 2024 | $1,434 | $33,184 | $3,120 | $30,064 |
| 2023 | $1,404 | $33,184 | $3,120 | $30,064 |
| 2022 | $942 | $33,184 | $3,120 | $30,064 |
| 2021 | $1,406 | $33,184 | $3,120 | $30,064 |
| 2020 | $1,711 | $33,184 | $3,120 | $30,064 |
| 2019 | $1,588 | $33,184 | $3,120 | $30,064 |
| 2018 | $1,044 | $33,184 | $3,120 | $30,064 |
| 2017 | $1,044 | $33,184 | $3,120 | $30,064 |
| 2016 | $1,457 | $32,984 | $3,120 | $29,864 |
| 2015 | $1,209 | $41,504 | $3,120 | $38,384 |
| 2014 | $1,212 | $41,504 | $3,120 | $38,384 |
| 2013 | -- | $41,504 | $3,120 | $38,384 |
Source: Public Records
Map
Nearby Homes
- 205 Valley Dr
- 1202 S Lee St
- 104 Westlake Cir
- 130 W Dodson St
- 1105 Elm Ave
- 126 Bell St
- 229 Bell St
- 704 Harrold Ave
- TBD Grande Ave
- 624 Harrold Ave
- 302 W College St
- 501 S Lee St
- 0 Beale St
- 406 S Hampton St
- 518 E Furlow St
- 316 Taylor St
- 211 Horne St
- 621 E Church St
- 105 Springfield Ave
- Lots 5 6 13 14 Hwy 49n