Estimated Value: $193,369 - $200,000
4
Beds
2
Baths
893
Sq Ft
$220/Sq Ft
Est. Value
About This Home
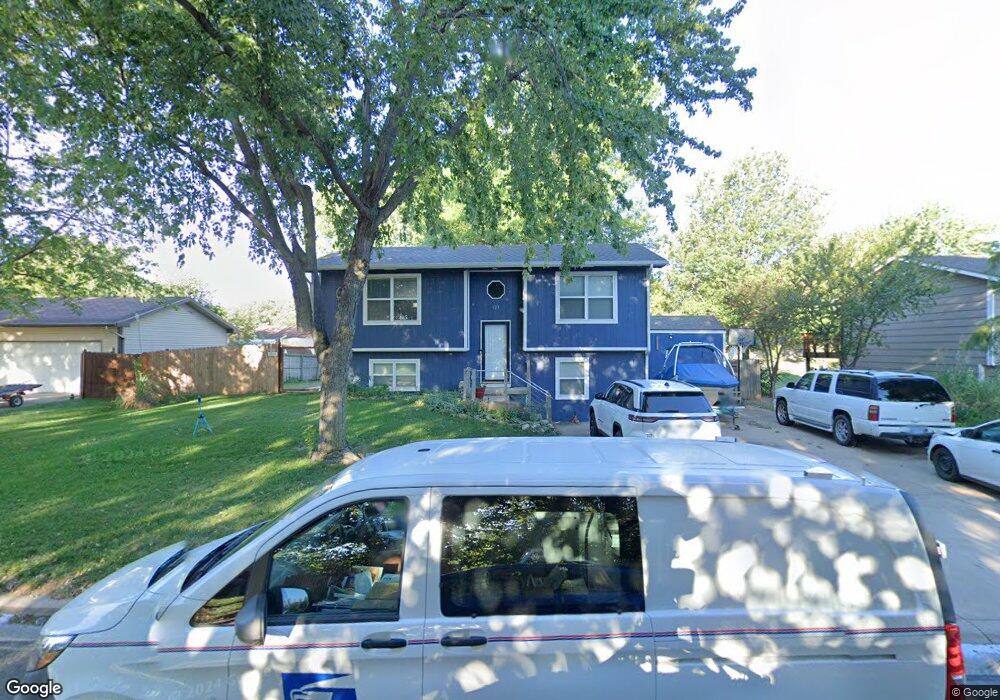
This home is located at 323 Shon St, Maize, KS 67101 and is currently estimated at $196,685, approximately $220 per square foot. 323 Shon St is a home located in Sedgwick County with nearby schools including Maize Middle School and Maize High School.
Ownership History
Date
Name
Owned For
Owner Type
Purchase Details
Closed on
Nov 16, 2018
Sold by
Deberry Jason and Deberry Misti
Bought by
Deberry Jason L and Deberry Misti
Current Estimated Value
Home Financials for this Owner
Home Financials are based on the most recent Mortgage that was taken out on this home.
Original Mortgage
$92,579
Outstanding Balance
$82,703
Interest Rate
5.62%
Mortgage Type
FHA
Estimated Equity
$113,982
Purchase Details
Closed on
Oct 6, 2006
Sold by
Blanton Cahrles L
Bought by
Deberry Jason and Deberry Jessica
Home Financials for this Owner
Home Financials are based on the most recent Mortgage that was taken out on this home.
Original Mortgage
$79,200
Interest Rate
6.47%
Mortgage Type
New Conventional
Purchase Details
Closed on
Aug 17, 2000
Sold by
Blanton Kimberly K
Bought by
Blanton Charles L
Create a Home Valuation Report for This Property
The Home Valuation Report is an in-depth analysis detailing your home's value as well as a comparison with similar homes in the area
Home Values in the Area
Average Home Value in this Area
Purchase History
| Date | Buyer | Sale Price | Title Company |
|---|---|---|---|
| Deberry Jason L | -- | Security 1St Title Llc | |
| Deberry Jason | -- | None Available | |
| Blanton Charles L | -- | -- |
Source: Public Records
Mortgage History
| Date | Status | Borrower | Loan Amount |
|---|---|---|---|
| Open | Deberry Jason L | $92,579 | |
| Closed | Deberry Jason | $79,200 |
Source: Public Records
Tax History
| Year | Tax Paid | Tax Assessment Tax Assessment Total Assessment is a certain percentage of the fair market value that is determined by local assessors to be the total taxable value of land and additions on the property. | Land | Improvement |
|---|---|---|---|---|
| 2025 | $2,571 | $19,493 | $5,014 | $14,479 |
| 2023 | $2,571 | $15,825 | $2,289 | $13,536 |
| 2022 | $2,207 | $14,789 | $2,162 | $12,627 |
| 2021 | $2,133 | $14,088 | $2,162 | $11,926 |
| 2020 | $1,987 | $13,168 | $2,162 | $11,006 |
| 2019 | $1,925 | $12,788 | $2,162 | $10,626 |
| 2018 | $1,820 | $12,064 | $1,553 | $10,511 |
| 2017 | $1,830 | $0 | $0 | $0 |
| 2016 | $1,756 | $0 | $0 | $0 |
| 2015 | $1,676 | $0 | $0 | $0 |
| 2014 | $1,659 | $0 | $0 | $0 |
Source: Public Records
Map
Nearby Homes
- 319 Jonathan St
- 415 S Sweetwater Rd
- 432 S Sweetwater Rd
- 403 S Sweetwater Rd
- 429 S Longbranch Dr
- 721 High Plains Cir
- 300 W Albert St Unit 4
- 10730 W 53rd St N
- 613 S Sweetwater Cir
- 11.6+/- Acres W 45th St N
- 634 S Sweetwater Rd
- 907 S James Ct
- 903 Stetson Cir
- 5463 Brisk Bay Ct
- 5468 N Briskbay Ct
- 5591 Wandering Way
- 5561 Wandering Way
- 5465 Brisk Bay Ct
- 628 S Longbranch Dr
- 5563 Wandering Way
Your Personal Tour Guide
Ask me questions while you tour the home.