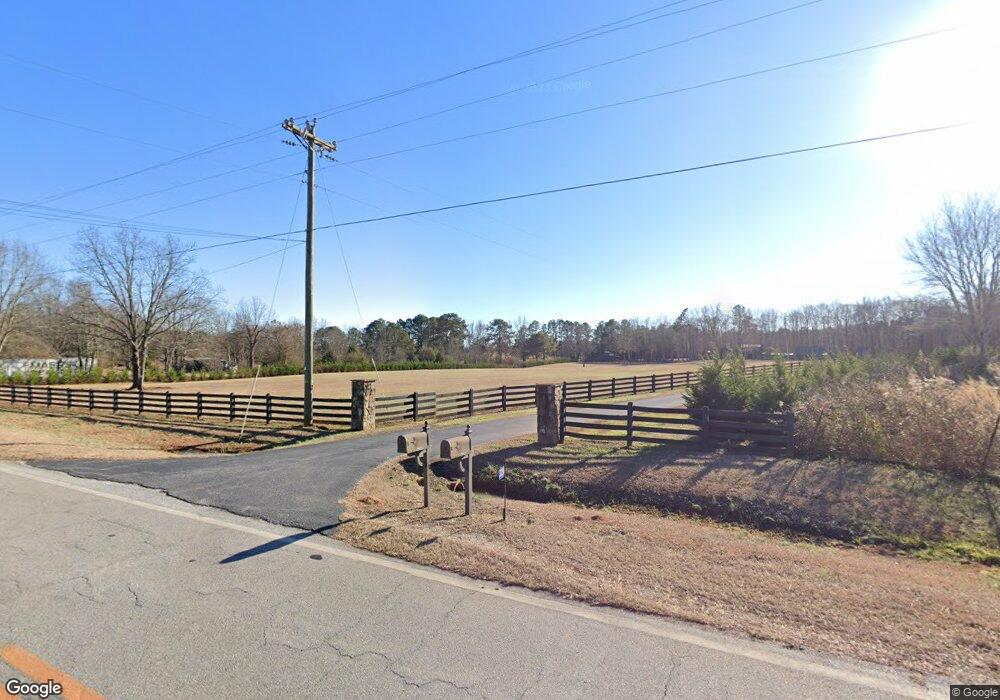
3230 Doster Rd Rutledge, GA 30663
Estimated Value: $492,408 - $725,000
3
Beds
2
Baths
2,506
Sq Ft
$240/Sq Ft
Est. Value
About This Home
This home is located at 3230 Doster Rd, Rutledge, GA 30663 and is currently estimated at $602,102, approximately $240 per square foot. 3230 Doster Rd is a home located in Morgan County with nearby schools including Morgan County Primary School, Morgan County Elementary School, and Morgan County Middle School.
Ownership History
Date
Name
Owned For
Owner Type
Purchase Details
Closed on
Nov 17, 2021
Sold by
Agee James Christopher
Bought by
Agee John Terry
Current Estimated Value
Home Financials for this Owner
Home Financials are based on the most recent Mortgage that was taken out on this home.
Original Mortgage
$100,000
Interest Rate
3.09%
Mortgage Type
New Conventional
Purchase Details
Closed on
Jan 25, 2021
Sold by
Walker Eugene P
Bought by
Agee James Christopher and Agee Susan Elizabeth
Purchase Details
Closed on
Aug 31, 2017
Sold by
Walker Eugene P
Bought by
Walker Eugene P and Walker Patricia C
Home Financials for this Owner
Home Financials are based on the most recent Mortgage that was taken out on this home.
Original Mortgage
$361,416
Interest Rate
4.12%
Mortgage Type
FHA
Purchase Details
Closed on
Aug 1, 2003
Sold by
Marett Robert M
Bought by
Walker Eugene P
Create a Home Valuation Report for This Property
The Home Valuation Report is an in-depth analysis detailing your home's value as well as a comparison with similar homes in the area
Home Values in the Area
Average Home Value in this Area
Purchase History
| Date | Buyer | Sale Price | Title Company |
|---|---|---|---|
| Agee John Terry | $400,000 | -- | |
| Agee James Christopher | $372,500 | -- | |
| Walker Eugene P | $370,000 | -- | |
| Walker Eugene P | $340,000 | -- |
Source: Public Records
Mortgage History
| Date | Status | Borrower | Loan Amount |
|---|---|---|---|
| Closed | Agee John Terry | $100,000 | |
| Previous Owner | Walker Eugene P | $361,416 |
Source: Public Records
Tax History
| Year | Tax Paid | Tax Assessment Tax Assessment Total Assessment is a certain percentage of the fair market value that is determined by local assessors to be the total taxable value of land and additions on the property. | Land | Improvement |
|---|---|---|---|---|
| 2025 | $4,918 | $219,456 | $52,431 | $167,025 |
| 2024 | $4,523 | $198,526 | $48,451 | $150,075 |
| 2023 | $4,127 | $175,590 | $41,160 | $134,430 |
| 2022 | $3,645 | $156,105 | $29,561 | $126,544 |
| 2021 | $3,296 | $146,175 | $28,153 | $118,022 |
| 2020 | $3,133 | $138,379 | $28,153 | $110,226 |
| 2019 | $3,184 | $138,379 | $28,153 | $110,226 |
| 2018 | $3,166 | $135,820 | $25,594 | $110,226 |
| 2017 | $3,506 | $135,334 | $25,850 | $109,484 |
| 2016 | $3,156 | $121,300 | $25,594 | $95,706 |
| 2015 | $3,073 | $116,680 | $23,200 | $93,480 |
| 2014 | $2,875 | $112,276 | $23,520 | $88,756 |
| 2013 | -- | $89,960 | $25,040 | $64,920 |
Source: Public Records
Map
Nearby Homes
- 0 Double Bridges Rd Unit Madison GA 30650
- 2950 Doster Rd
- 2870 Prospect Rd
- 3380 Fairplay Rd
- 1051 Lake Rutledge Rd
- 2720 Doster Rd
- 0 Doster Rd Unit 2720
- LOT 3 Mallory Rd
- 4318 Hester Town Rd
- LOT 14 Wallace Rd
- LOT 8 Wallace Rd
- 0 W Dixie Hwy Unit 10499573
- 1310 Deerwood Dr
- 305 Fairplay St
- 1041 Cooper Ln
- 4000 Bostwick Hwy
- 1150 Harris Hollis Ln
- 178 Fairplay St
- 170 Fairplay St
- 4610 Atlanta Hwy
- 3190 Doster Rd
- 1241 Greenwood Rd
- 3201 Doster Rd
- 3341 Doster Rd
- 3141 Doster Rd
- 2791 Double Bridges Rd
- 2641 Double Bridges Rd
- 3480 Doster Rd
- 3251 Doster Rd
- 3451 Doster Rd
- 3471 Doster Rd
- 2982 Doster Rd
- 2991 Doster Rd
- 2981 Doster Rd
- 2800 Double Bridges Rd
- 2421 Double Bridges Rd
- 3031 Doster Rd
- 3041 Doster Rd
- 2370 Fambrough Bridge Rd
- 1 Prospect Rd
Your Personal Tour Guide
Ask me questions while you tour the home.