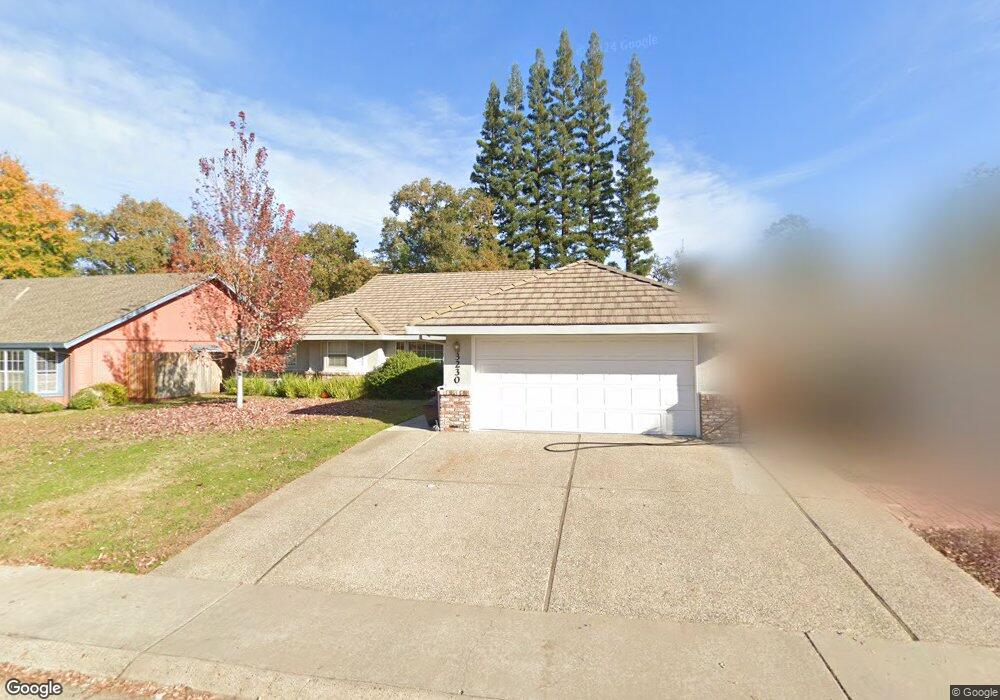
3230 Max Ct Carmichael, CA 95608
Carmichael Town Center NeighborhoodEstimated Value: $693,030 - $814,000
3
Beds
2
Baths
2,284
Sq Ft
$330/Sq Ft
Est. Value
About This Home
This home is located at 3230 Max Ct, Carmichael, CA 95608 and is currently estimated at $754,008, approximately $330 per square foot. 3230 Max Ct is a home located in Sacramento County with nearby schools including Carmichael Elementary School, John Barrett Middle School, and Del Campo High School.
Ownership History
Date
Name
Owned For
Owner Type
Purchase Details
Closed on
Aug 25, 2025
Sold by
Mastagni David P and Mastagni Kathleen R
Bought by
Mastagni Family Trust and Mastagni
Current Estimated Value
Purchase Details
Closed on
Jul 15, 2019
Sold by
Mastagni Angela Ann and Patricia Kennedy Living Trust
Bought by
Mastagni David Phillip
Purchase Details
Closed on
Jun 13, 2018
Sold by
Kennedy Patricia
Bought by
Kennedy Patricia Rae and Patricia Kennedy Living Trust
Purchase Details
Closed on
Apr 23, 2012
Sold by
Mastagni David
Bought by
Mastagni Kathleen R
Purchase Details
Closed on
Dec 16, 2008
Sold by
Kennedy Patricia
Bought by
Kennedy Patricia and Mastagni David
Purchase Details
Closed on
Feb 13, 2007
Sold by
Mastagni David and Mastagni Daniel
Bought by
Kennedy Patricia
Purchase Details
Closed on
Apr 20, 2001
Sold by
Mastagni Natalie and Emil B & Natalie Mastagni 1991
Bought by
Mastagni Natalie and Emil B & Natalie Mastagni 1991
Create a Home Valuation Report for This Property
The Home Valuation Report is an in-depth analysis detailing your home's value as well as a comparison with similar homes in the area
Home Values in the Area
Average Home Value in this Area
Purchase History
| Date | Buyer | Sale Price | Title Company |
|---|---|---|---|
| Mastagni Family Trust | -- | None Listed On Document | |
| Mastagni David P | -- | None Listed On Document | |
| Mastagni David P | -- | None Listed On Document | |
| Mastagni David Phillip | -- | None Available | |
| Kennedy Patricia Rae | -- | None Available | |
| Mastagni Kathleen R | -- | None Available | |
| Kennedy Patricia | -- | None Available | |
| Kennedy Patricia | $525,000 | North American Title Co | |
| Mastagni Natalie | -- | -- |
Source: Public Records
Tax History
| Year | Tax Paid | Tax Assessment Tax Assessment Total Assessment is a certain percentage of the fair market value that is determined by local assessors to be the total taxable value of land and additions on the property. | Land | Improvement |
|---|---|---|---|---|
| 2025 | $7,067 | $595,245 | $105,308 | $489,937 |
| 2024 | $7,067 | $583,575 | $103,244 | $480,331 |
| 2023 | $6,955 | $572,133 | $101,220 | $470,913 |
| 2022 | $6,816 | $560,916 | $99,236 | $461,680 |
| 2021 | $6,704 | $549,919 | $97,291 | $452,628 |
| 2020 | $6,579 | $544,281 | $96,294 | $447,987 |
| 2019 | $7,111 | $588,880 | $159,510 | $429,370 |
| 2018 | $6,940 | $577,334 | $156,383 | $420,951 |
| 2017 | $6,875 | $566,015 | $153,317 | $412,698 |
| 2016 | $6,420 | $554,917 | $150,311 | $404,606 |
| 2015 | $6,354 | $546,583 | $148,054 | $398,529 |
| 2014 | $6,221 | $535,877 | $145,154 | $390,723 |
Source: Public Records
Map
Nearby Homes
- 3125 Colorado St
- 3312 Jayanne Way
- 3332 Jayanne Way
- 2905 Garfield Ave
- 7032 Fair Oaks Blvd Unit 1
- 3431 Hunter Ln
- 5631 Engle Rd
- 6001 Grant Ave
- 2855 La Colina Way
- 6129 Merry Ln
- 6130 Sizemore Ln
- 5151 Janell Way
- 5113 Walnut Garden Ct
- 5236 Marconi Ave
- 6200 Kiernan Dr
- 5316 Engle Rd
- 5530 Kenneth Ave
- 2901 California Ave
- 2546 El Vita Way
- 2804 California Ave
Your Personal Tour Guide
Ask me questions while you tour the home.