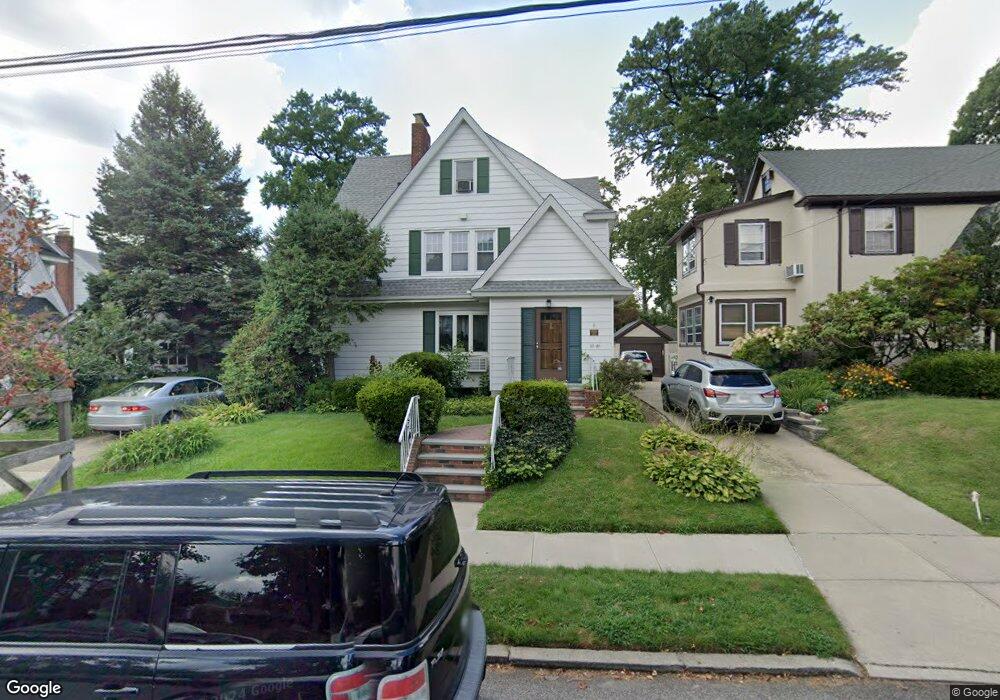
3232 159th St Flushing, NY 11358
Murray Hill-Broadway NeighborhoodEstimated Value: $1,403,000 - $1,450,000
Studio
--
Bath
2,090
Sq Ft
$686/Sq Ft
Est. Value
About This Home
This home is located at 3232 159th St, Flushing, NY 11358 and is currently estimated at $1,433,873, approximately $686 per square foot. 3232 159th St is a home located in Queens County with nearby schools including P.S. 32 - State Street, I.S. 25 Adrien Block, and Francis Lewis High School.
Ownership History
Date
Name
Owned For
Owner Type
Purchase Details
Closed on
May 29, 2015
Sold by
Mistretta Annamaria and Mistretta Charles V
Bought by
Annamaria L Mistretta 2015 Revocable Tr and Annamaria L Mistretta Trustee
Current Estimated Value
Purchase Details
Closed on
Mar 11, 2004
Sold by
Mistretta Deceased Charles V and Mistretta Executor
Bought by
Dahinten Maureen and Im Alten Grund No 20
Create a Home Valuation Report for This Property
The Home Valuation Report is an in-depth analysis detailing your home's value as well as a comparison with similar homes in the area
Home Values in the Area
Average Home Value in this Area
Purchase History
| Date | Buyer | Sale Price | Title Company |
|---|---|---|---|
| Annamaria L Mistretta 2015 Revocable Tr | -- | -- | |
| Annamaria L Mistretta 2015 Revocable Tr | -- | -- | |
| Annamaria L Mistretta 2015 Revocable Tr | -- | -- | |
| Dahinten Maureen | -- | -- | |
| Dahinten Maureen | -- | -- |
Source: Public Records
Tax History
| Year | Tax Paid | Tax Assessment Tax Assessment Total Assessment is a certain percentage of the fair market value that is determined by local assessors to be the total taxable value of land and additions on the property. | Land | Improvement |
|---|---|---|---|---|
| 2025 | $11,131 | $55,418 | $14,686 | $40,732 |
| 2024 | $11,131 | $55,418 | $16,297 | $39,121 |
| 2023 | $11,169 | $54,997 | $14,749 | $40,248 |
| 2022 | $9,831 | $75,480 | $24,120 | $51,360 |
| 2021 | $10,301 | $70,440 | $24,120 | $46,320 |
| 2020 | $9,775 | $70,320 | $24,120 | $46,200 |
| 2019 | $9,661 | $68,280 | $24,120 | $44,160 |
| 2018 | $9,587 | $45,831 | $15,965 | $29,866 |
| 2017 | $8,814 | $43,238 | $18,690 | $24,548 |
| 2016 | $8,154 | $43,238 | $18,690 | $24,548 |
| 2015 | -- | $38,485 | $18,699 | $19,786 |
Source: Public Records
Map
Nearby Homes
Your Personal Tour Guide
Ask me questions while you tour the home.