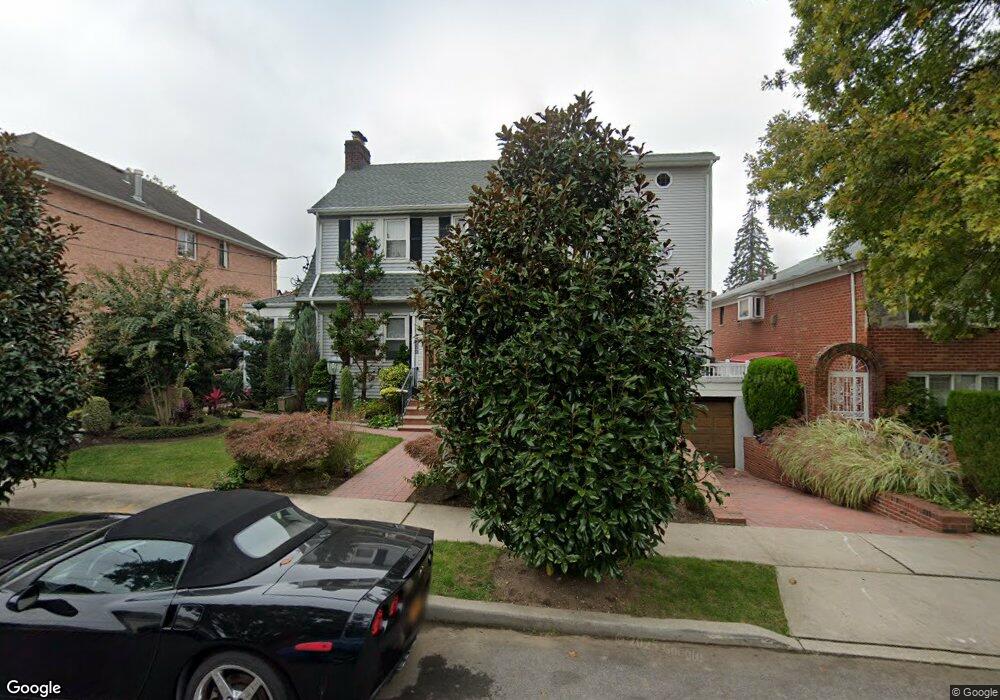
3232 168th St Flushing, NY 11358
Murray Hill-Broadway NeighborhoodEstimated Value: $1,541,196 - $1,800,000
Studio
--
Bath
2,765
Sq Ft
$587/Sq Ft
Est. Value
About This Home
This home is located at 3232 168th St, Flushing, NY 11358 and is currently estimated at $1,624,299, approximately $587 per square foot. 3232 168th St is a home located in Queens County with nearby schools including P.S. 32 - State Street, I.S. 25 Adrien Block, and Francis Lewis High School.
Ownership History
Date
Name
Owned For
Owner Type
Purchase Details
Closed on
Jan 28, 2002
Sold by
Kane Timothy P
Bought by
Kane Meryl
Current Estimated Value
Purchase Details
Closed on
Jul 8, 1996
Sold by
Doyle James and Doyle Salvatrice
Bought by
Kane Timothy P
Home Financials for this Owner
Home Financials are based on the most recent Mortgage that was taken out on this home.
Original Mortgage
$288,000
Interest Rate
8.08%
Create a Home Valuation Report for This Property
The Home Valuation Report is an in-depth analysis detailing your home's value as well as a comparison with similar homes in the area
Home Values in the Area
Average Home Value in this Area
Purchase History
| Date | Buyer | Sale Price | Title Company |
|---|---|---|---|
| Kane Meryl | -- | -- | |
| Kane Timothy P | $320,000 | First American Title Ins Co |
Source: Public Records
Mortgage History
| Date | Status | Borrower | Loan Amount |
|---|---|---|---|
| Previous Owner | Kane Timothy P | $288,000 |
Source: Public Records
Tax History
| Year | Tax Paid | Tax Assessment Tax Assessment Total Assessment is a certain percentage of the fair market value that is determined by local assessors to be the total taxable value of land and additions on the property. | Land | Improvement |
|---|---|---|---|---|
| 2025 | $12,227 | $61,510 | $15,304 | $46,206 |
| 2024 | $12,227 | $60,877 | $16,419 | $44,458 |
| 2023 | $11,535 | $57,432 | $15,612 | $41,820 |
| 2022 | $10,817 | $91,860 | $24,840 | $67,020 |
| 2021 | $10,787 | $86,820 | $24,840 | $61,980 |
| 2020 | $10,850 | $85,200 | $24,840 | $60,360 |
| 2019 | $10,612 | $83,340 | $24,840 | $58,500 |
| 2018 | $9,756 | $47,860 | $18,397 | $29,463 |
| 2017 | $9,204 | $45,153 | $17,454 | $27,699 |
| 2016 | $8,539 | $45,153 | $17,454 | $27,699 |
| 2015 | $4,918 | $42,715 | $21,784 | $20,931 |
| 2014 | $4,918 | $42,276 | $25,860 | $16,416 |
Source: Public Records
Map
Nearby Homes
Your Personal Tour Guide
Ask me questions while you tour the home.