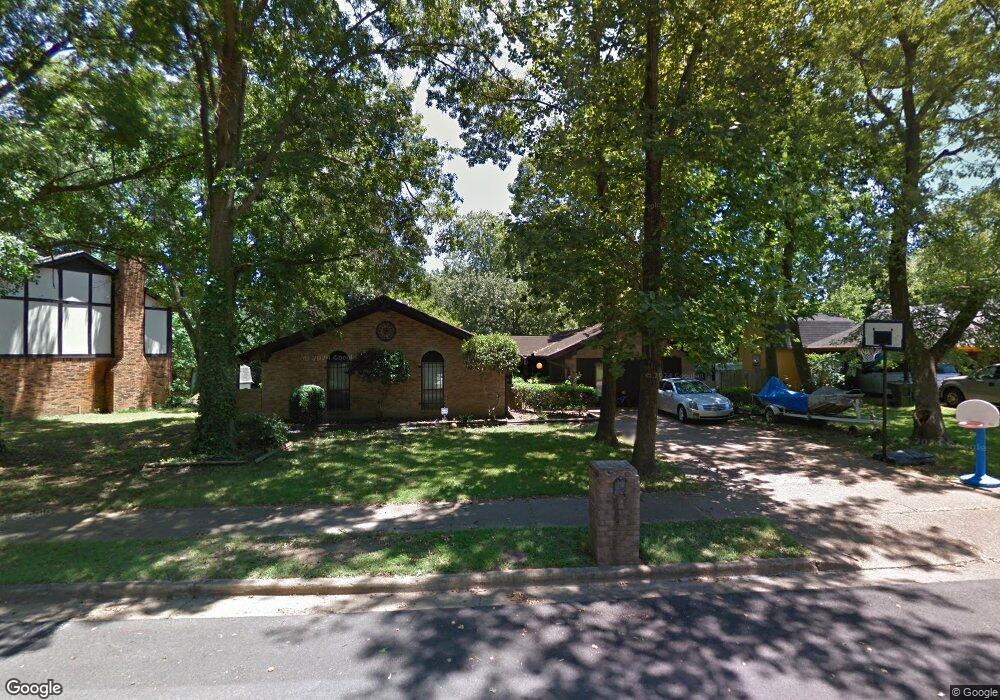
3234 Dumbeath Cove Memphis, TN 38128
Frayser NeighborhoodEstimated Value: $246,000 - $260,000
3
Beds
2
Baths
2,771
Sq Ft
$91/Sq Ft
Est. Value
About This Home
This home is located at 3234 Dumbeath Cove, Memphis, TN 38128 and is currently estimated at $252,044, approximately $90 per square foot. 3234 Dumbeath Cove is a home located in Shelby County with nearby schools including Scenic Hills Elementary School, Raleigh Egypt High School, and Coleman School.
Ownership History
Date
Name
Owned For
Owner Type
Purchase Details
Closed on
Nov 24, 2004
Sold by
Martin Venita M
Bought by
Boykins Ivory M and Boykins Glenda
Current Estimated Value
Home Financials for this Owner
Home Financials are based on the most recent Mortgage that was taken out on this home.
Original Mortgage
$102,000
Outstanding Balance
$50,494
Interest Rate
5.66%
Mortgage Type
Purchase Money Mortgage
Estimated Equity
$201,550
Purchase Details
Closed on
Jun 29, 2000
Sold by
Collins Rebecca R
Bought by
Collins Michael L
Home Financials for this Owner
Home Financials are based on the most recent Mortgage that was taken out on this home.
Original Mortgage
$124,900
Interest Rate
8.12%
Purchase Details
Closed on
Jun 23, 2000
Sold by
Collins Michael L
Bought by
Martin Venita M
Home Financials for this Owner
Home Financials are based on the most recent Mortgage that was taken out on this home.
Original Mortgage
$124,900
Interest Rate
8.12%
Create a Home Valuation Report for This Property
The Home Valuation Report is an in-depth analysis detailing your home's value as well as a comparison with similar homes in the area
Home Values in the Area
Average Home Value in this Area
Purchase History
| Date | Buyer | Sale Price | Title Company |
|---|---|---|---|
| Boykins Ivory M | $127,500 | -- | |
| Collins Michael L | -- | -- | |
| Martin Venita M | $124,900 | -- |
Source: Public Records
Mortgage History
| Date | Status | Borrower | Loan Amount |
|---|---|---|---|
| Open | Boykins Ivory M | $102,000 | |
| Previous Owner | Martin Venita M | $124,900 | |
| Closed | Boykins Ivory M | $25,500 |
Source: Public Records
Tax History Compared to Growth
Tax History
| Year | Tax Paid | Tax Assessment Tax Assessment Total Assessment is a certain percentage of the fair market value that is determined by local assessors to be the total taxable value of land and additions on the property. | Land | Improvement |
|---|---|---|---|---|
| 2025 | $1,352 | $72,750 | $5,650 | $67,100 |
| 2024 | $1,352 | $39,875 | $4,550 | $35,325 |
| 2023 | $2,429 | $39,875 | $4,550 | $35,325 |
| 2022 | $2,429 | $39,875 | $4,550 | $35,325 |
| 2021 | $2,458 | $39,875 | $4,550 | $35,325 |
| 2020 | $2,310 | $31,875 | $4,550 | $27,325 |
| 2019 | $2,310 | $31,875 | $4,550 | $27,325 |
| 2018 | $2,310 | $31,875 | $4,550 | $27,325 |
| 2017 | $1,310 | $31,875 | $4,550 | $27,325 |
| 2016 | $1,065 | $24,375 | $0 | $0 |
| 2014 | $1,065 | $31,375 | $0 | $0 |
Source: Public Records
Map
Nearby Homes
- 3243 Dumbeath Cove
- 3021 Whitney Ave
- 3090 Taransay Rd Unit 20
- 0 Taransay Rd
- 3046 Carnoustie Cove
- 0 Helmsdale Rd
- 3095 Spring Hill Dr
- 3228 Whitney Ave
- 2869 Dumbarton Oaks Dr
- 2995 Frayser-Raleigh Rd
- 3034 Bannockburn Rd
- 2976 Scotland Rd
- 3356 William Tell Dr
- 2793 Frayser Blvd
- 2958 E Glengarry Rd
- 3121 S Glengarry Rd
- 2714 Nix Cove
- 2701 Frayser Blvd
- 2593 Sandpiper Ave
- 0 Allen Rd Unit 10207133
- 3244 Dumbeath Cove
- 3016 Dumbeath Rd
- 3030 Dumbeath Rd
- 3252 Dumbeath Cove
- 3237 Canisbay Rd
- 3219 Canisbay Rd
- 3245 Canisbay Rd
- 3235 Dumbeath Cove
- 3000 Dumbeath Rd
- 3251 Dumbeath Cove
- 3255 Canisbay Rd
- 3256 Dumbeath Cove
- 3021 Dumbeath Rd
- 3011 Dumbeath Rd
- 3031 Dumbeath Rd
- 3255 Dumbeath Cove
- 2990 Dumbeath Rd
- 3001 Dumbeath Rd
- 3209 Canisbay Rd
- 3263 Canisbay Rd