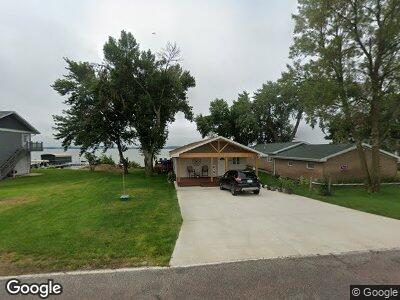
3236 335th Ave Ruthven, IA 51358
Estimated Value: $284,762 - $361,000
2
Beds
2
Baths
1,104
Sq Ft
$297/Sq Ft
Est. Value
About This Home
This home is located at 3236 335th Ave, Ruthven, IA 51358 and is currently estimated at $327,941, approximately $297 per square foot. 3236 335th Ave is a home located in Clay County with nearby schools including Ruthven-Ayrshire Elementary School and Ruthven-Ayrshire High School.
Ownership History
Date
Name
Owned For
Owner Type
Purchase Details
Closed on
Mar 26, 2018
Sold by
Christensen Daniel L and Christensen Michelle R
Bought by
Snavely Terry and Snavely Gertrude
Current Estimated Value
Purchase Details
Closed on
Feb 3, 2012
Sold by
Lickteig Mark and Lickteig Wendy
Bought by
Vogel Samuel J and Vogel Jana L
Home Financials for this Owner
Home Financials are based on the most recent Mortgage that was taken out on this home.
Original Mortgage
$229,500
Interest Rate
3.9%
Mortgage Type
New Conventional
Create a Home Valuation Report for This Property
The Home Valuation Report is an in-depth analysis detailing your home's value as well as a comparison with similar homes in the area
Home Values in the Area
Average Home Value in this Area
Purchase History
| Date | Buyer | Sale Price | Title Company |
|---|---|---|---|
| Snavely Terry | $273,000 | -- | |
| Vogel Samuel J | $255,000 | None Available |
Source: Public Records
Mortgage History
| Date | Status | Borrower | Loan Amount |
|---|---|---|---|
| Previous Owner | Vogel Samuel J | $229,500 |
Source: Public Records
Tax History Compared to Growth
Tax History
| Year | Tax Paid | Tax Assessment Tax Assessment Total Assessment is a certain percentage of the fair market value that is determined by local assessors to be the total taxable value of land and additions on the property. | Land | Improvement |
|---|---|---|---|---|
| 2024 | $3,150 | $276,570 | $144,000 | $132,570 |
| 2023 | $3,472 | $262,420 | $144,000 | $118,420 |
| 2022 | $3,514 | $248,400 | $144,000 | $104,400 |
| 2021 | $3,446 | $250,420 | $144,000 | $106,420 |
| 2020 | $3,446 | $245,270 | $144,000 | $101,270 |
| 2019 | $3,282 | $246,460 | $0 | $0 |
| 2018 | $3,218 | $246,460 | $0 | $0 |
| 2017 | $3,188 | $243,530 | $0 | $0 |
| 2016 | $3,178 | $243,530 | $0 | $0 |
| 2015 | $2,896 | $227,390 | $0 | $0 |
| 2014 | $2,896 | $227,390 | $0 | $0 |
Source: Public Records
Map
Nearby Homes