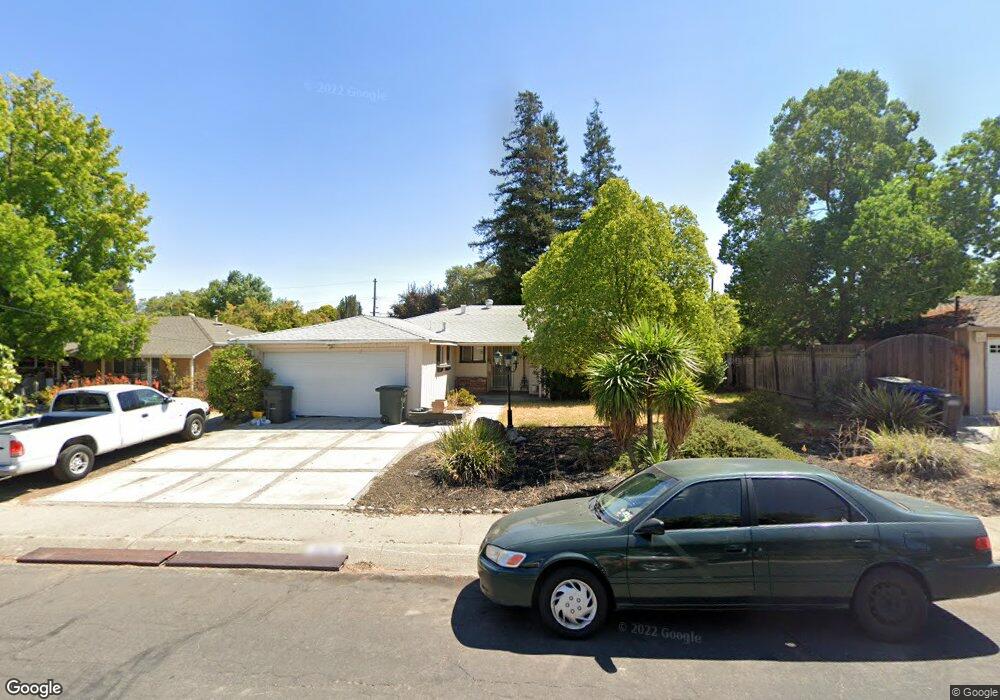
3236 Claudia Dr Concord, CA 94519
Holbrook Heights NeighborhoodEstimated Value: $618,391 - $711,000
3
Beds
2
Baths
1,172
Sq Ft
$563/Sq Ft
Est. Value
About This Home
This home is located at 3236 Claudia Dr, Concord, CA 94519 and is currently estimated at $660,348, approximately $563 per square foot. 3236 Claudia Dr is a home located in Contra Costa County with nearby schools including Holbrook Language Academy, El Dorado Middle School, and Mt. Diablo High School.
Ownership History
Date
Name
Owned For
Owner Type
Purchase Details
Closed on
Oct 25, 2018
Sold by
Overton Archie
Bought by
Overton Archie
Current Estimated Value
Purchase Details
Closed on
Nov 19, 2007
Sold by
Robinson Steve P
Bought by
Overton Archie
Home Financials for this Owner
Home Financials are based on the most recent Mortgage that was taken out on this home.
Original Mortgage
$267,200
Outstanding Balance
$168,885
Interest Rate
6.36%
Mortgage Type
Purchase Money Mortgage
Estimated Equity
$491,463
Purchase Details
Closed on
Sep 11, 1997
Sold by
Robinson Steve P
Bought by
Robinson Steve P
Create a Home Valuation Report for This Property
The Home Valuation Report is an in-depth analysis detailing your home's value as well as a comparison with similar homes in the area
Home Values in the Area
Average Home Value in this Area
Purchase History
| Date | Buyer | Sale Price | Title Company |
|---|---|---|---|
| Overton Archie | -- | None Available | |
| Overton Archie | $334,000 | North American Title Company | |
| Robinson Steve P | -- | -- |
Source: Public Records
Mortgage History
| Date | Status | Borrower | Loan Amount |
|---|---|---|---|
| Open | Overton Archie | $267,200 |
Source: Public Records
Tax History
| Year | Tax Paid | Tax Assessment Tax Assessment Total Assessment is a certain percentage of the fair market value that is determined by local assessors to be the total taxable value of land and additions on the property. | Land | Improvement |
|---|---|---|---|---|
| 2025 | $5,855 | $438,696 | $249,560 | $189,136 |
| 2024 | $5,699 | $430,095 | $244,667 | $185,428 |
| 2023 | $5,584 | $421,663 | $239,870 | $181,793 |
| 2022 | $5,500 | $413,396 | $235,167 | $178,229 |
| 2021 | $5,359 | $405,291 | $230,556 | $174,735 |
| 2019 | $5,251 | $393,271 | $223,718 | $169,553 |
| 2018 | $5,048 | $385,561 | $219,332 | $166,229 |
| 2017 | $4,875 | $378,002 | $215,032 | $162,970 |
| 2016 | $4,731 | $370,591 | $210,816 | $159,775 |
| 2015 | $4,066 | $311,000 | $176,917 | $134,083 |
| 2014 | $3,904 | $298,000 | $169,521 | $128,479 |
Source: Public Records
Map
Nearby Homes
- 3242 Ida Dr
- 3185 Claudia Dr
- 3179 Meadowbrook Dr
- 2653 Garden Ave
- 2219 Acacia Dr
- 2156 Holbrook Dr
- 3128 Esperanza Dr
- 2644 E Olivera Rd
- 2719 Grant St
- 2780 Argyll Ave
- 2102 Overhill Rd
- 2766 Argyll Ave
- 3485 Hillsborough Dr
- 2819 Kay Ave
- 2758 Wexford Dr
- 3114 Ameno Rd
- 2719 Edward Ave
- 3617 Sanford St
- 2251 Pacheco St
- 3162 Salvio St
Your Personal Tour Guide
Ask me questions while you tour the home.