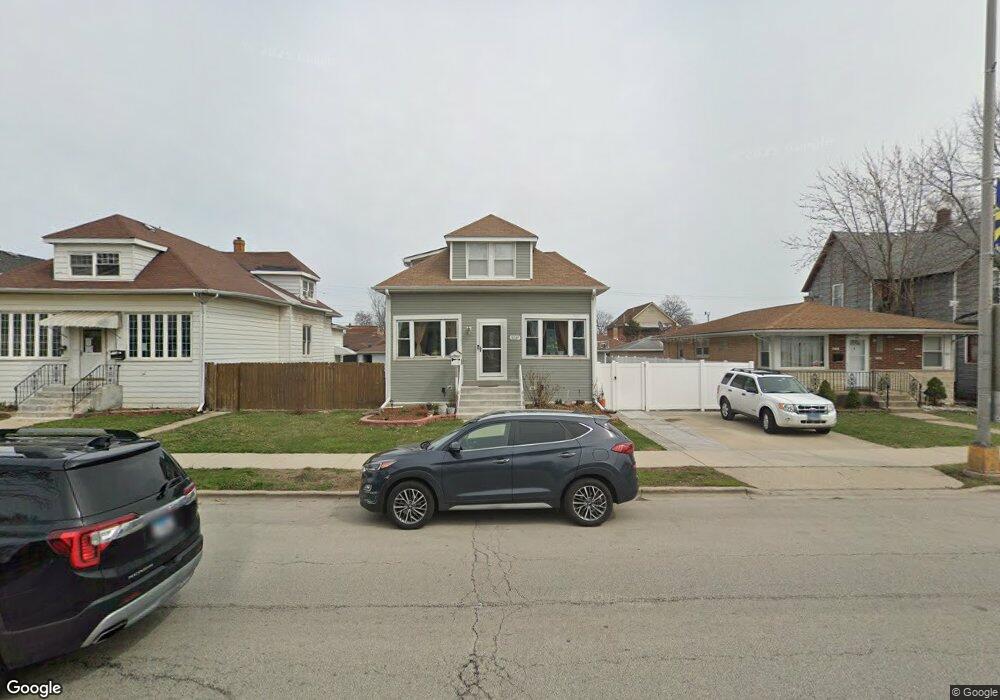
3237 Rose St Franklin Park, IL 60131
Estimated Value: $282,000 - $330,000
4
Beds
1
Bath
1,068
Sq Ft
$286/Sq Ft
Est. Value
About This Home
This home is located at 3237 Rose St, Franklin Park, IL 60131 and is currently estimated at $304,924, approximately $285 per square foot. 3237 Rose St is a home located in Cook County with nearby schools including North Elementary School, Hester Jr High School, and East Leyden High School.
Ownership History
Date
Name
Owned For
Owner Type
Purchase Details
Closed on
Oct 25, 2002
Sold by
Barron Gerardo and Barron Martina
Bought by
Barron Gerardo and Barron Martina
Current Estimated Value
Home Financials for this Owner
Home Financials are based on the most recent Mortgage that was taken out on this home.
Original Mortgage
$145,000
Interest Rate
6.18%
Purchase Details
Closed on
Aug 10, 1999
Sold by
Barron Gerardo and Barron Carmen
Bought by
Barron Gerardo and Barron Martina
Purchase Details
Closed on
Aug 20, 1997
Sold by
Malec Leonard S and Malec Leonard
Bought by
Barron Gerardo and Barron Martina
Home Financials for this Owner
Home Financials are based on the most recent Mortgage that was taken out on this home.
Original Mortgage
$150,307
Interest Rate
7.56%
Mortgage Type
FHA
Create a Home Valuation Report for This Property
The Home Valuation Report is an in-depth analysis detailing your home's value as well as a comparison with similar homes in the area
Home Values in the Area
Average Home Value in this Area
Purchase History
| Date | Buyer | Sale Price | Title Company |
|---|---|---|---|
| Barron Gerardo | -- | Multiple | |
| Barron Gerardo | -- | -- | |
| Barron Gerardo | $102,666 | -- |
Source: Public Records
Mortgage History
| Date | Status | Borrower | Loan Amount |
|---|---|---|---|
| Closed | Barron Gerardo | $145,000 | |
| Closed | Barron Gerardo | $150,307 |
Source: Public Records
Tax History Compared to Growth
Tax History
| Year | Tax Paid | Tax Assessment Tax Assessment Total Assessment is a certain percentage of the fair market value that is determined by local assessors to be the total taxable value of land and additions on the property. | Land | Improvement |
|---|---|---|---|---|
| 2024 | $5,334 | $24,013 | $5,580 | $18,433 |
| 2023 | $5,470 | $24,686 | $5,580 | $19,106 |
| 2022 | $5,470 | $24,686 | $5,580 | $19,106 |
| 2021 | $5,125 | $16,269 | $4,030 | $12,239 |
| 2020 | $4,962 | $16,269 | $4,030 | $12,239 |
| 2019 | $5,181 | $18,383 | $4,030 | $14,353 |
| 2018 | $4,855 | $15,468 | $3,410 | $12,058 |
| 2017 | $4,809 | $15,468 | $3,410 | $12,058 |
| 2016 | $4,794 | $15,468 | $3,410 | $12,058 |
| 2015 | $5,166 | $15,853 | $3,100 | $12,753 |
| 2014 | $5,050 | $15,853 | $3,100 | $12,753 |
| 2013 | $4,660 | $15,853 | $3,100 | $12,753 |
Source: Public Records
Map
Nearby Homes