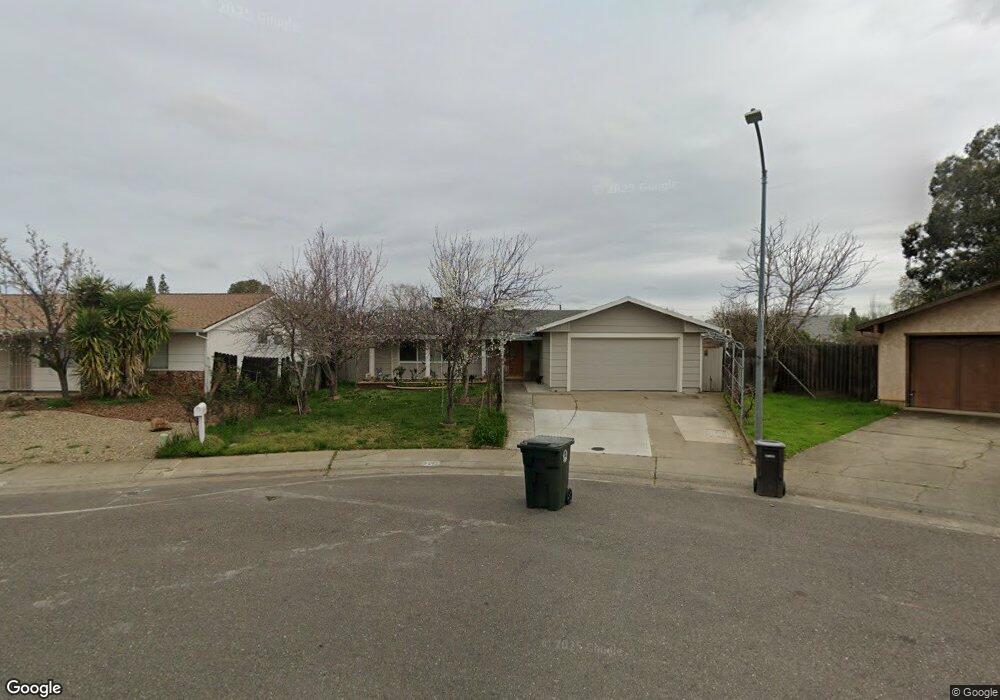
3237 Sanbury Cir Rancho Cordova, CA 95670
South White Rock NeighborhoodEstimated Value: $352,000 - $449,174
4
Beds
2
Baths
1,578
Sq Ft
$258/Sq Ft
Est. Value
About This Home
This home is located at 3237 Sanbury Cir, Rancho Cordova, CA 95670 and is currently estimated at $407,794, approximately $258 per square foot. 3237 Sanbury Cir is a home located in Sacramento County with nearby schools including Cordova Villa Elementary School, Mills Middle School, and Cordova High School.
Ownership History
Date
Name
Owned For
Owner Type
Purchase Details
Closed on
Oct 19, 2020
Sold by
Boone John E and Boone Sharon E
Bought by
Boone John E and Boone Sharon E
Current Estimated Value
Purchase Details
Closed on
Feb 12, 2008
Sold by
Slivinskaya Svetlana and Slivinskiy Grigoriy
Bought by
Slivinskiy Valentin
Purchase Details
Closed on
May 6, 1998
Sold by
Slivinskaya Lidiya
Bought by
Slivinskiy Grigoriy
Home Financials for this Owner
Home Financials are based on the most recent Mortgage that was taken out on this home.
Original Mortgage
$60,000
Interest Rate
7.1%
Purchase Details
Closed on
May 5, 1998
Sold by
The Chase Manhattan Bank
Bought by
Slivinskaya Svetlana and Slivinskiy Grigoriy
Home Financials for this Owner
Home Financials are based on the most recent Mortgage that was taken out on this home.
Original Mortgage
$60,000
Interest Rate
7.1%
Purchase Details
Closed on
Mar 20, 1998
Sold by
Mcdoanld Stephen R and Mcdoanld Darlene S
Bought by
The Chase Manhattan Bank
Home Financials for this Owner
Home Financials are based on the most recent Mortgage that was taken out on this home.
Original Mortgage
$60,000
Interest Rate
7.1%
Create a Home Valuation Report for This Property
The Home Valuation Report is an in-depth analysis detailing your home's value as well as a comparison with similar homes in the area
Home Values in the Area
Average Home Value in this Area
Purchase History
| Date | Buyer | Sale Price | Title Company |
|---|---|---|---|
| Boone John E | -- | None Available | |
| Slivinskiy Valentin | -- | None Available | |
| Slivinskiy Grigoriy | -- | Fidelity National Title Ins | |
| Slivinskaya Svetlana | $78,000 | Fidelity National Title Ins | |
| The Chase Manhattan Bank | $84,000 | -- |
Source: Public Records
Mortgage History
| Date | Status | Borrower | Loan Amount |
|---|---|---|---|
| Previous Owner | Slivinskaya Svetlana | $60,000 | |
| Closed | Slivinskaya Svetlana | $3,120 |
Source: Public Records
Tax History Compared to Growth
Tax History
| Year | Tax Paid | Tax Assessment Tax Assessment Total Assessment is a certain percentage of the fair market value that is determined by local assessors to be the total taxable value of land and additions on the property. | Land | Improvement |
|---|---|---|---|---|
| 2025 | $2,577 | $124,513 | $47,884 | $76,629 |
| 2024 | $2,577 | $122,073 | $46,946 | $75,127 |
| 2023 | $2,329 | $119,680 | $46,026 | $73,654 |
| 2022 | $2,296 | $117,334 | $45,124 | $72,210 |
| 2021 | $1,952 | $115,035 | $44,240 | $70,795 |
| 2020 | $1,455 | $113,857 | $43,787 | $70,070 |
| 2019 | $1,432 | $111,626 | $42,929 | $68,697 |
| 2018 | $1,395 | $109,438 | $42,088 | $67,350 |
| 2017 | $1,360 | $107,293 | $41,263 | $66,030 |
| 2016 | $1,313 | $105,190 | $40,454 | $64,736 |
| 2015 | $1,247 | $103,611 | $39,847 | $63,764 |
| 2014 | $1,327 | $101,582 | $39,067 | $62,515 |
Source: Public Records
Map
Nearby Homes
- 10395 S White Rock Rd Unit B
- 10276 S White Rock Rd
- 10850 Basie Way
- 10834 Basie Way
- 10806 Basie Way
- 10472 Abbottford Way
- 10518 Mills Acres Cir
- 10335 White Rock Rd
- 10320 Malaga Way
- 10732 Paiute Way
- 2669 Dawes St
- 10228 Coloma Rd
- 2640 Tronero Way
- 10035 Mills Station Rd
- 10035 Mills Station Rd Unit 60
- 10035 Mills Station Rd Unit 26
- 10035 Mills Station Rd Unit 136
- 10035 Mills Station Rd Unit 153
- 10035 Mills Station Rd Unit 73
- 2724 Zinfandel Dr
- 3233 Sanbury Cir
- 3241 Sanbury Cir
- 10377 S White Rock Rd
- 10377 S White Rock Rd
- 10371 S White Rock Rd
- 10371 S White Rock Rd
- 3229 Sanbury Cir
- 3245 Sanbury Cir
- 10387 S White Rock Rd
- 10387 S White Rock Rd
- 3234 Sanbury Cir
- 3225 Sanbury Cir
- 3249 Sanbury Cir
- 3230 Sanbury Cir
- 10369 S White Rock Rd
- 10369 S White Rock Rd
- 10395 S White Rock Rd Unit A
- 10395 S White Rock Rd
- 10395 S White Rock Rd
- 10391 S White Rock Rd Unit B