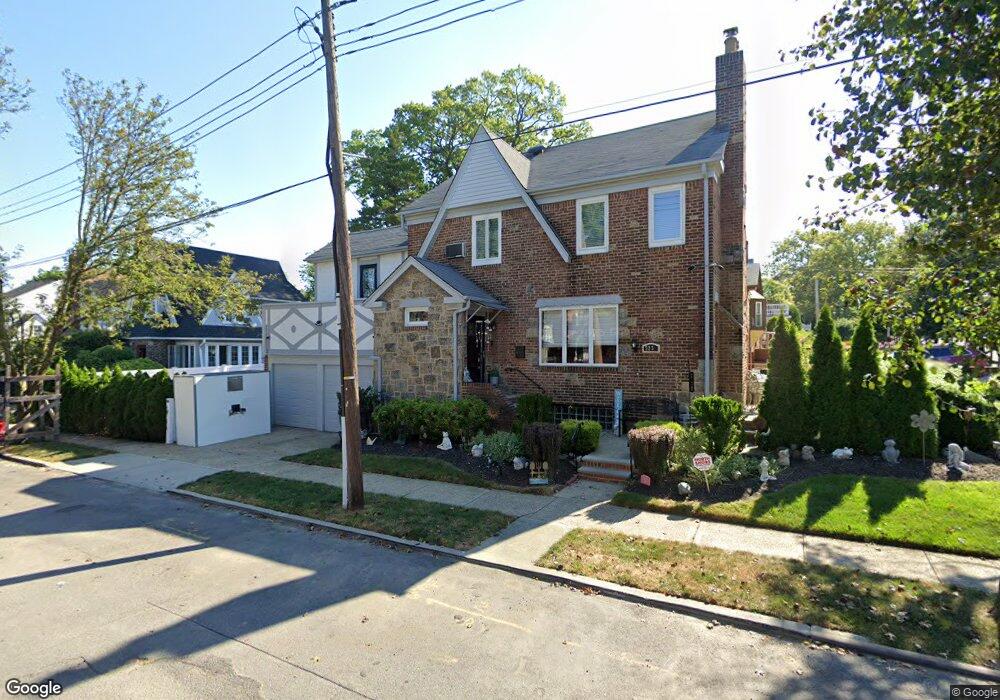
3239 166th St Flushing, NY 11358
Flushing NeighborhoodEstimated Value: $1,073,000 - $1,664,000
Studio
--
Bath
1,374
Sq Ft
$921/Sq Ft
Est. Value
About This Home
This home is located at 3239 166th St, Flushing, NY 11358 and is currently estimated at $1,265,840, approximately $921 per square foot. 3239 166th St is a home located in Queens County with nearby schools including P.S. 32 - State Street, I.S. 25 Adrien Block, and Francis Lewis High School.
Ownership History
Date
Name
Owned For
Owner Type
Purchase Details
Closed on
Jan 11, 2019
Sold by
Connor Patricia A
Bought by
Armato Christine and Priolo Christopher
Current Estimated Value
Home Financials for this Owner
Home Financials are based on the most recent Mortgage that was taken out on this home.
Original Mortgage
$788,000
Outstanding Balance
$694,212
Interest Rate
4.7%
Mortgage Type
Purchase Money Mortgage
Estimated Equity
$571,628
Create a Home Valuation Report for This Property
The Home Valuation Report is an in-depth analysis detailing your home's value as well as a comparison with similar homes in the area
Home Values in the Area
Average Home Value in this Area
Purchase History
| Date | Buyer | Sale Price | Title Company |
|---|---|---|---|
| Armato Christine | $985,000 | -- |
Source: Public Records
Mortgage History
| Date | Status | Borrower | Loan Amount |
|---|---|---|---|
| Open | Armato Christine | $788,000 |
Source: Public Records
Tax History Compared to Growth
Tax History
| Year | Tax Paid | Tax Assessment Tax Assessment Total Assessment is a certain percentage of the fair market value that is determined by local assessors to be the total taxable value of land and additions on the property. | Land | Improvement |
|---|---|---|---|---|
| 2025 | $8,759 | $46,228 | $17,684 | $28,544 |
| 2024 | $8,759 | $43,611 | $15,673 | $27,938 |
| 2023 | $8,263 | $41,142 | $15,155 | $25,987 |
| 2022 | $9,042 | $62,940 | $22,080 | $40,860 |
| 2021 | $8,992 | $61,740 | $22,080 | $39,660 |
| 2020 | $11,376 | $58,620 | $22,080 | $36,540 |
| 2019 | $10,644 | $56,340 | $22,080 | $34,260 |
| 2018 | $9,488 | $48,002 | $16,478 | $31,524 |
| 2017 | $8,932 | $45,285 | $18,516 | $26,769 |
| 2016 | $8,644 | $45,285 | $18,516 | $26,769 |
| 2015 | $4,933 | $44,788 | $21,912 | $22,876 |
| 2014 | $4,933 | $42,402 | $24,053 | $18,349 |
Source: Public Records
Map
Nearby Homes