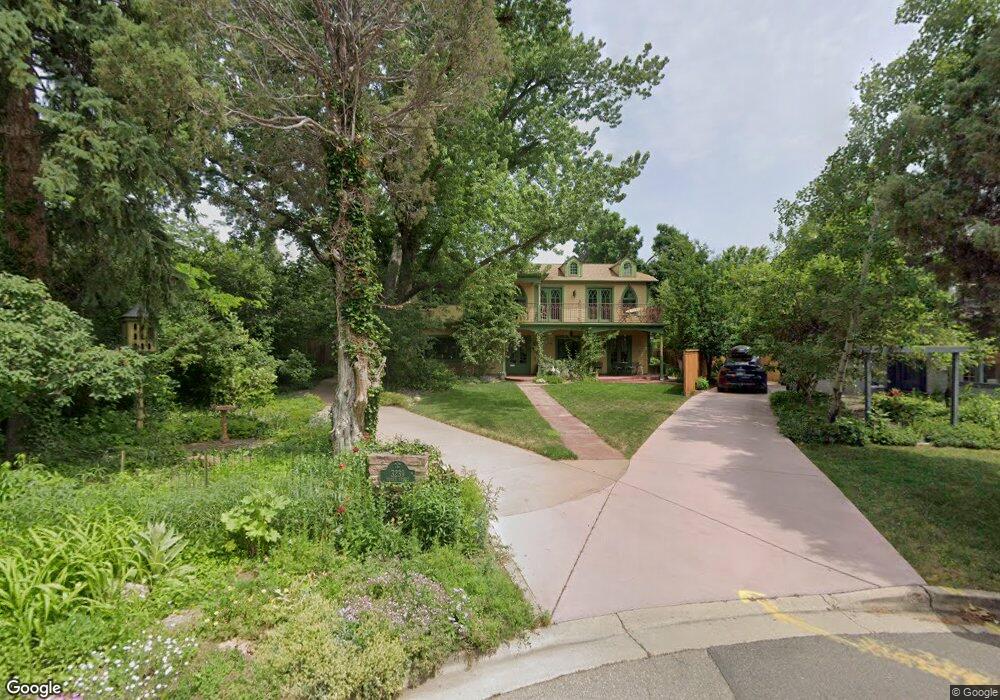
3239 8th St Boulder, CO 80304
Newlands NeighborhoodEstimated Value: $2,142,000 - $3,259,000
3
Beds
2
Baths
2,954
Sq Ft
$883/Sq Ft
Est. Value
About This Home
This home is located at 3239 8th St, Boulder, CO 80304 and is currently estimated at $2,609,540, approximately $883 per square foot. 3239 8th St is a home located in Boulder County with nearby schools including Foothill Elementary School, Casey Middle School, and Boulder High School.
Ownership History
Date
Name
Owned For
Owner Type
Purchase Details
Closed on
Jun 8, 1992
Bought by
Low David Victor
Current Estimated Value
Purchase Details
Closed on
Dec 6, 1990
Bought by
Low David Victor
Purchase Details
Closed on
May 1, 1990
Bought by
Low David Victor
Purchase Details
Closed on
Oct 22, 1984
Bought by
Low David Victor
Create a Home Valuation Report for This Property
The Home Valuation Report is an in-depth analysis detailing your home's value as well as a comparison with similar homes in the area
Home Values in the Area
Average Home Value in this Area
Purchase History
We collect this data history from publicly available records. To have your information removed, we recommend requesting removal directly through your county’s website.
| Date | Buyer | Sale Price | Title Company |
|---|---|---|---|
| Low David Victor | $170,000 | -- | |
| Low David Victor | -- | -- | |
| Low David Victor | -- | -- | |
| Low David Victor | -- | -- |
Source: Public Records
Tax History
| Year | Tax Paid | Tax Assessment Tax Assessment Total Assessment is a certain percentage of the fair market value that is determined by local assessors to be the total taxable value of land and additions on the property. | Land | Improvement |
|---|---|---|---|---|
| 2025 | $16,013 | $147,632 | $103,138 | $44,494 |
| 2024 | $16,013 | $147,632 | $103,138 | $44,494 |
| 2023 | $16,314 | $188,907 | $131,608 | $60,983 |
| 2022 | $14,308 | $154,075 | $94,513 | $59,562 |
| 2021 | $13,644 | $158,509 | $97,233 | $61,276 |
| 2020 | $11,324 | $130,095 | $86,158 | $43,937 |
| 2019 | $11,151 | $130,095 | $86,158 | $43,937 |
| 2018 | $9,595 | $110,671 | $69,120 | $41,551 |
| 2017 | $9,295 | $122,353 | $76,416 | $45,937 |
| 2016 | $8,606 | $99,413 | $59,143 | $40,270 |
| 2015 | $8,149 | $81,327 | $44,178 | $37,149 |
| 2014 | $6,838 | $81,327 | $44,178 | $37,149 |
Source: Public Records
Map
Nearby Homes
- 640 Iris Ave
- 3181 9th St
- 656 Juniper Ave
- 521 Hawthorn Ave
- 503 Hawthorn Ave
- 620 Juniper Ave
- 706 Juniper Ave
- 3231 11th St
- 705 Juniper Ave
- 1070 Juniper Ave
- 3189 5th St
- 440 Japonica Way
- 3315 Broadway St
- 3135 11th St
- 3217 Broadway St
- 3319 Broadway
- 501 Evergreen Ave
- 3134 11th St
- 1127 Juniper Ave
- 3360 Broadway St
- 775 Grape Ave
- 755 Grape Ave
- 825 Grape Ave
- 745 Grape Ave
- 730 Hawthorn Ave
- 802 Hawthorn Ave
- 780 Grape Ave
- 760 Grape Ave
- 720 Hawthorn Ave
- 806 Hawthorn Ave
- 845 Grape Ave
- 730 Grape Ave
- 725 Grape Ave
- 830 Grape Ave
- 710 Hawthorn Ave
- 810 Hawthorn Ave
- 700 Grape Ave
- 705 Grape Ave
- 865 Grape G Ave
- 865 Grape X Ave
Your Personal Tour Guide
Ask me questions while you tour the home.