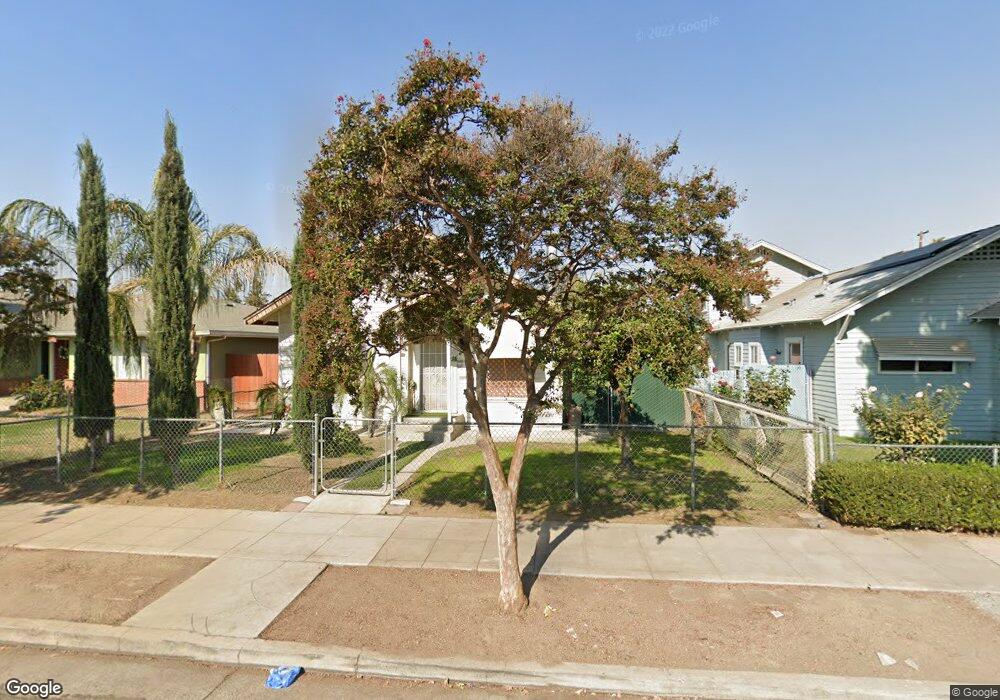
3239 E Iowa Ave Fresno, CA 93702
Huntington NeighborhoodEstimated Value: $238,931 - $303,000
3
Beds
1
Bath
1,171
Sq Ft
$234/Sq Ft
Est. Value
About This Home
This home is located at 3239 E Iowa Ave, Fresno, CA 93702 and is currently estimated at $273,977, approximately $233 per square foot. 3239 E Iowa Ave is a home located in Fresno County with nearby schools including Rowell Elementary School, Yosemite Middle School, and Mclane High School.
Ownership History
Date
Name
Owned For
Owner Type
Purchase Details
Closed on
May 29, 2024
Sold by
Paredes Martin
Bought by
Martin Paredes Living Trust and Paredes
Current Estimated Value
Purchase Details
Closed on
May 22, 2024
Sold by
Paredes Martin
Bought by
Martin Paredes Living Trust and Paredes
Purchase Details
Closed on
Nov 11, 2008
Sold by
Hsbc Bank Usa National Association
Bought by
Paredes Martin
Home Financials for this Owner
Home Financials are based on the most recent Mortgage that was taken out on this home.
Original Mortgage
$75,997
Interest Rate
5.14%
Mortgage Type
FHA
Purchase Details
Closed on
Sep 4, 2008
Sold by
Galvan Carlos
Bought by
Hsbc Bank Usa Na
Purchase Details
Closed on
Mar 16, 2005
Sold by
Srabian Morris and Srabian Lucille
Bought by
Galvan Carlos
Home Financials for this Owner
Home Financials are based on the most recent Mortgage that was taken out on this home.
Original Mortgage
$162,900
Interest Rate
6.95%
Mortgage Type
Purchase Money Mortgage
Purchase Details
Closed on
Aug 26, 2004
Sold by
Chambers Mark S and Chambers Rebecca S
Bought by
Srabian Morris and Srabian Lucille
Create a Home Valuation Report for This Property
The Home Valuation Report is an in-depth analysis detailing your home's value as well as a comparison with similar homes in the area
Home Values in the Area
Average Home Value in this Area
Purchase History
| Date | Buyer | Sale Price | Title Company |
|---|---|---|---|
| Martin Paredes Living Trust | -- | None Listed On Document | |
| Martin Paredes Living Trust | -- | None Listed On Document | |
| Paredes Martin | $77,000 | First American Title Company | |
| Hsbc Bank Usa Na | $60,775 | Landsafe Title | |
| Galvan Carlos | $181,000 | Fidelity National Title Co | |
| Srabian Morris | $95,000 | First American Title Ins Co |
Source: Public Records
Mortgage History
| Date | Status | Borrower | Loan Amount |
|---|---|---|---|
| Previous Owner | Paredes Martin | $75,997 | |
| Previous Owner | Galvan Carlos | $162,900 |
Source: Public Records
Tax History
| Year | Tax Paid | Tax Assessment Tax Assessment Total Assessment is a certain percentage of the fair market value that is determined by local assessors to be the total taxable value of land and additions on the property. | Land | Improvement |
|---|---|---|---|---|
| 2025 | $1,216 | $99,143 | $38,625 | $60,518 |
| 2023 | $1,145 | $95,295 | $37,126 | $58,169 |
| 2022 | $1,128 | $93,428 | $36,399 | $57,029 |
| 2021 | $1,096 | $91,597 | $35,686 | $55,911 |
| 2020 | $1,090 | $90,659 | $35,321 | $55,338 |
| 2019 | $1,047 | $88,882 | $34,629 | $54,253 |
| 2018 | $1,023 | $87,140 | $33,950 | $53,190 |
| 2017 | $1,004 | $85,433 | $33,285 | $52,148 |
| 2016 | $969 | $83,759 | $32,633 | $51,126 |
| 2015 | $954 | $82,502 | $32,143 | $50,359 |
| 2014 | $932 | $80,887 | $31,514 | $49,373 |
Source: Public Records
Map
Nearby Homes
- 3348 E Mckenzie Ave
- 3243 E Mckenzie Ave
- 3028 E Grant Ave
- 3004 E Madison Ave
- 3764 E Iowa Ave
- 555 S Raisina St
- 535 N 5th St
- 3801 E Mckenzie Ave
- 2845 E Madison Ave
- 3804 E Kerckhoff Ave
- 2881 Huntington Blvd Unit 150
- 2881 Huntington Blvd Unit 126
- 2881 Huntington Blvd Unit 235
- 2881 Huntington Blvd Unit 262
- 108 N 9th St
- 2948 E Tulare Ave
- 3044 E Cesar Chavez Blvd
- 2524 E Grant Ave
- 2522 E Grant Ave
- 523 S 8th St
- 3241 E Iowa Ave
- 3233 E Iowa Ave
- 3243 E Iowa Ave
- 3231 E Iowa Ave
- 3254 E Illinois Ave
- 3246 E Illinois Ave
- 3258 E Illinois Ave
- 3238 E Iowa Ave Unit 2
- 3238 E Iowa Ave
- 3258 E Iowa Ave
- 3221 E Iowa Ave
- 3260 E Illinois Ave
- 3236 E Iowa Ave
- 3240 E Iowa Ave
- 3228 E Illinois Ave
- 125 N 3rd St
- 3234 E Iowa Ave
- 3207 E Iowa Ave
- 3307 E Iowa Ave
- 3205 E Iowa Ave
Your Personal Tour Guide
Ask me questions while you tour the home.