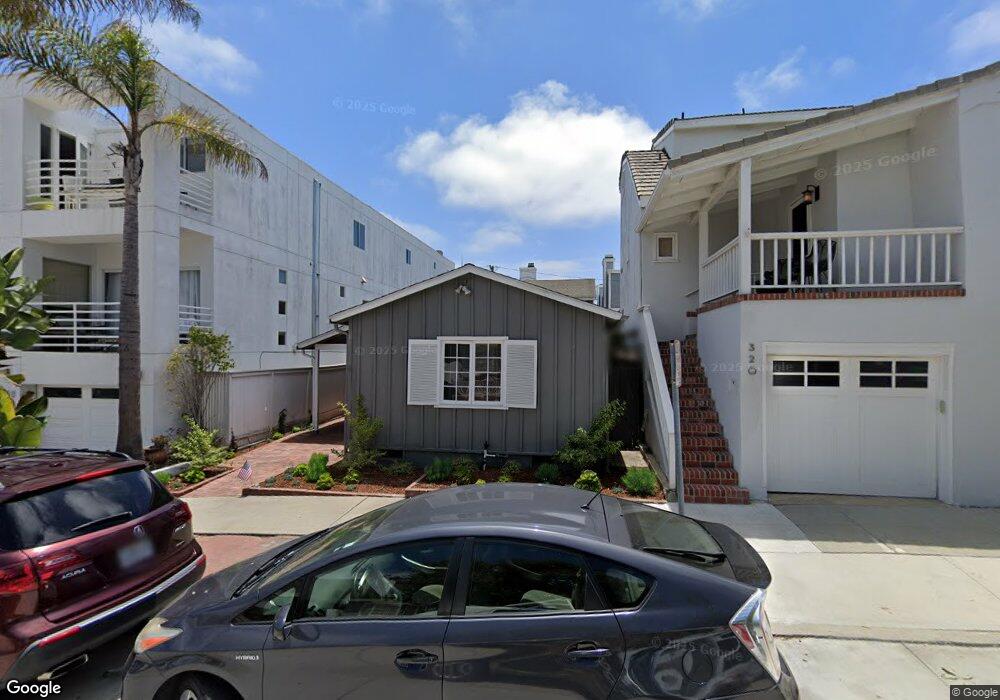
324 3rd St Manhattan Beach, CA 90266
Estimated Value: $2,134,589 - $4,043,000
2
Beds
2
Baths
1,384
Sq Ft
$2,215/Sq Ft
Est. Value
About This Home
This home is located at 324 3rd St, Manhattan Beach, CA 90266 and is currently estimated at $3,065,196, approximately $2,214 per square foot. 324 3rd St is a home located in Los Angeles County with nearby schools including Opal Robinson Elementary School, Manhattan Beach Middle School, and Mira Costa High School.
Ownership History
Date
Name
Owned For
Owner Type
Purchase Details
Closed on
Jun 10, 2024
Sold by
Tom And Ann Martin Family Trust and Martin Ann R
Bought by
Tom And Ann Martin Family Trust and Martin
Current Estimated Value
Purchase Details
Closed on
Sep 8, 2015
Sold by
Martin Thomas and Martin Ann R
Bought by
The Tom & Ann Martin Family Trust
Purchase Details
Closed on
Sep 5, 2000
Sold by
Martin Ann R
Bought by
Martin Ann R and The Tom & Ann Martin Family Tr
Purchase Details
Closed on
Nov 18, 1999
Sold by
Family Trust Martin Thomas And Ann R Trs Mart
Bought by
Martin Ann R
Purchase Details
Closed on
Nov 26, 1997
Sold by
Martin Ann R and Martin Allyson M
Bought by
Ar Martin Thomas and Ar Martin Ann
Purchase Details
Closed on
Aug 17, 1995
Sold by
Martin Thomas and Martin Ann R
Bought by
Martin Ann R and Martin Allyson M
Create a Home Valuation Report for This Property
The Home Valuation Report is an in-depth analysis detailing your home's value as well as a comparison with similar homes in the area
Home Values in the Area
Average Home Value in this Area
Purchase History
| Date | Buyer | Sale Price | Title Company |
|---|---|---|---|
| Tom And Ann Martin Family Trust | -- | None Listed On Document | |
| The Tom & Ann Martin Family Trust | -- | None Available | |
| Martin Thomas | -- | None Available | |
| Martin Ann R | -- | -- | |
| Martin Ann R | -- | Investors Title | |
| Ar Martin Thomas | -- | Investors Title Company | |
| Martin Ann R | -- | -- |
Source: Public Records
Tax History
| Year | Tax Paid | Tax Assessment Tax Assessment Total Assessment is a certain percentage of the fair market value that is determined by local assessors to be the total taxable value of land and additions on the property. | Land | Improvement |
|---|---|---|---|---|
| 2025 | $6,570 | $544,245 | $352,163 | $192,082 |
| 2024 | $6,570 | $533,574 | $345,258 | $188,316 |
| 2023 | $6,353 | $523,113 | $338,489 | $184,624 |
| 2022 | $6,250 | $512,856 | $331,852 | $181,004 |
| 2021 | $6,206 | $502,801 | $325,346 | $177,455 |
| 2020 | $6,151 | $497,646 | $322,010 | $175,636 |
| 2019 | $6,048 | $487,890 | $315,697 | $172,193 |
| 2018 | $5,905 | $478,324 | $309,507 | $168,817 |
| 2016 | $5,335 | $459,752 | $297,490 | $162,262 |
| 2015 | $5,227 | $452,847 | $293,022 | $159,825 |
| 2014 | $5,168 | $443,978 | $287,283 | $156,695 |
Source: Public Records
Map
Nearby Homes
- 98 Highland Ave
- 213 Bayview Dr
- 212 Manhattan Ave
- 89 Bayview Dr
- 541 4th St
- 231 Longfellow Ave
- 229 7th St
- 207 S Poinsettia Ave
- 215 S Poinsettia Ave
- 2919 Hermosa View Dr
- 626 Longfellow Ave
- 920 The Strand
- 934 1st St
- 124 11th St
- 2900 Hermosa View Dr
- 525 Manhattan Beach Blvd
- 2526 Hermosa Ave
- 1140 Fisher Ave
- 620 12th St
- 2965 La Carlita St
Your Personal Tour Guide
Ask me questions while you tour the home.