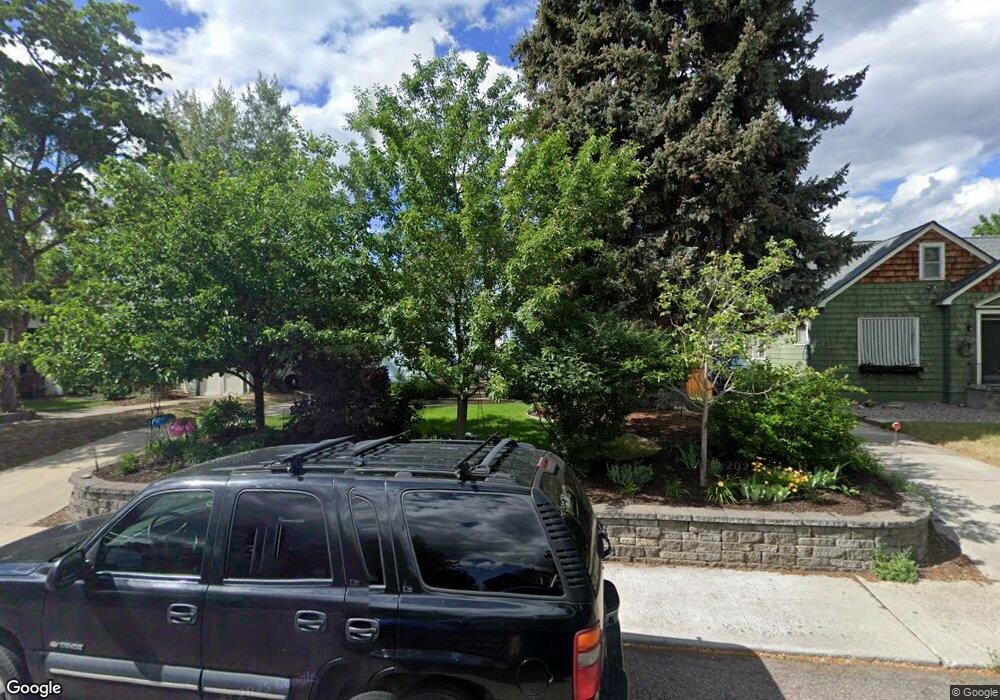
324 E Central Ave Missoula, MT 59801
University District NeighborhoodEstimated Value: $717,000 - $770,000
4
Beds
2
Baths
1,018
Sq Ft
$731/Sq Ft
Est. Value
About This Home
This home is located at 324 E Central Ave, Missoula, MT 59801 and is currently estimated at $743,881, approximately $730 per square foot. 324 E Central Ave is a home located in Missoula County with nearby schools including Paxson School, Washington Middle School, and Sentinel High School.
Ownership History
Date
Name
Owned For
Owner Type
Purchase Details
Closed on
Jul 3, 2008
Sold by
Beamer Celine A
Bought by
Shepherd Celine A Beamer and Shepherd David M
Current Estimated Value
Home Financials for this Owner
Home Financials are based on the most recent Mortgage that was taken out on this home.
Original Mortgage
$238,000
Outstanding Balance
$53,333
Interest Rate
6.04%
Mortgage Type
New Conventional
Estimated Equity
$690,548
Purchase Details
Closed on
Jun 30, 2004
Sold by
Russell Wendelin A
Bought by
Beamer Celine A
Home Financials for this Owner
Home Financials are based on the most recent Mortgage that was taken out on this home.
Original Mortgage
$212,000
Interest Rate
5%
Mortgage Type
Purchase Money Mortgage
Purchase Details
Closed on
Jul 30, 2001
Sold by
Goldberg Stuart and Goldberg Stephen A
Bought by
Russell Wendelin A
Create a Home Valuation Report for This Property
The Home Valuation Report is an in-depth analysis detailing your home's value as well as a comparison with similar homes in the area
Home Values in the Area
Average Home Value in this Area
Purchase History
| Date | Buyer | Sale Price | Title Company |
|---|---|---|---|
| Shepherd Celine A Beamer | -- | Title Services Inc | |
| Beamer Celine A | -- | Title Services Inc | |
| Russell Wendelin A | -- | -- |
Source: Public Records
Mortgage History
| Date | Status | Borrower | Loan Amount |
|---|---|---|---|
| Open | Shepherd Celine A Beamer | $238,000 | |
| Closed | Beamer Celine A | $212,000 | |
| Closed | Beamer Celine A | $17,500 |
Source: Public Records
Tax History
| Year | Tax Paid | Tax Assessment Tax Assessment Total Assessment is a certain percentage of the fair market value that is determined by local assessors to be the total taxable value of land and additions on the property. | Land | Improvement |
|---|---|---|---|---|
| 2025 | $7,355 | $741,700 | $334,920 | $406,780 |
| 2024 | $7,056 | $579,900 | $274,170 | $305,730 |
| 2023 | $6,801 | $579,900 | $274,170 | $305,730 |
| 2022 | $6,259 | $463,000 | $0 | $0 |
| 2021 | $5,625 | $463,000 | $0 | $0 |
| 2020 | $5,262 | $402,100 | $0 | $0 |
| 2019 | $5,245 | $402,100 | $0 | $0 |
| 2018 | $4,972 | $370,600 | $0 | $0 |
| 2017 | $4,922 | $370,600 | $0 | $0 |
| 2016 | $3,958 | $310,500 | $0 | $0 |
| 2015 | $3,665 | $310,500 | $0 | $0 |
| 2014 | $3,564 | $170,077 | $0 | $0 |
Source: Public Records
Map
Nearby Homes
- 2321 Gerald Ave
- 140 W Sussex Ave
- 655 Woodworth Ave
- 211 Benton Ave
- 831 Hastings Ave
- 1325 Gerald Ave
- 839 Evans Ave
- 443 Kensington Ave
- 921 E Beckwith Ave
- 470 Strand Ave
- 405 Agnes Ave
- 706 South Ave W
- 1005 Gerald Ave
- 300 Connell Ave
- 225 Eddy Ave
- 542 Eddy Ave
- 415 S 6th St E
- 722, 724, 728, 730, Rollins St
- 516 S 5th St E
- 1105 Stephens Ave Unit 2
- 318 E Central Ave
- 328 E Central Ave
- 2108 Ronald Ave
- 321 E Kent Ave
- 317 E Kent Ave
- 340 E Central Ave
- 329 E Kent Ave
- 303 E Kent Ave
- 325 E Central Ave
- 323 E Central Ave
- 329 E Central Ave
- 333 E Kent Ave
- 2205 Hilda Ave
- 2200 Ronald Ave
- 2105 Ronald Ave
- 2217 Hilda Ave
- 2103 Ronald Ave
- 220 E Central Ave
- 2108 Hilda Ave
- 312 E Sussex Ave
Your Personal Tour Guide
Ask me questions while you tour the home.