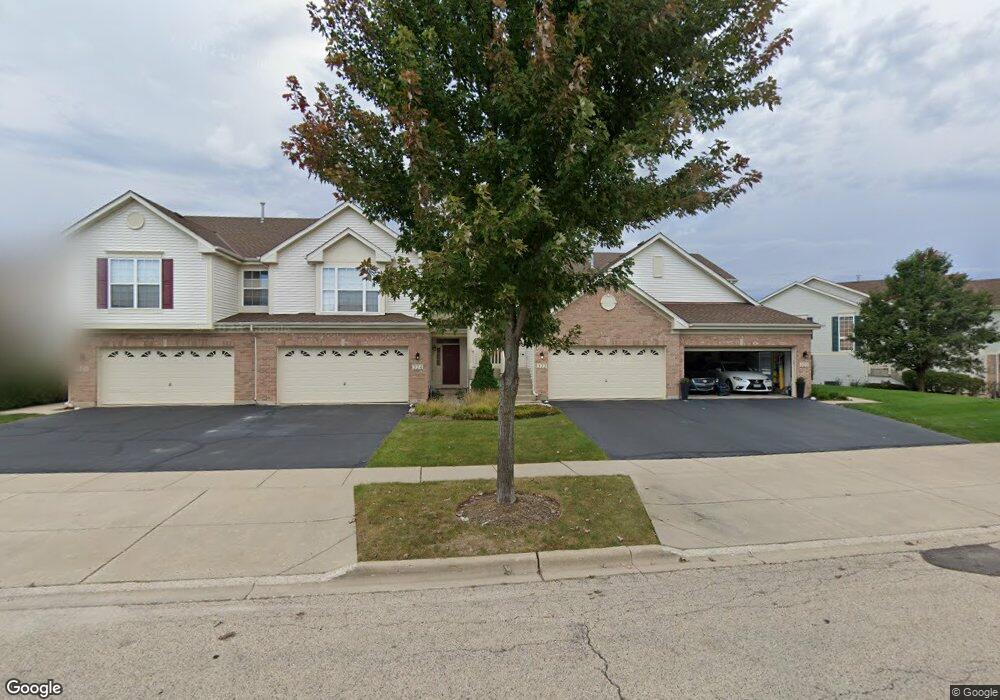
324 Emerald Ln Algonquin, IL 60102
Estimated Value: $306,000 - $319,000
3
Beds
3
Baths
1,610
Sq Ft
$194/Sq Ft
Est. Value
About This Home
This home is located at 324 Emerald Ln, Algonquin, IL 60102 and is currently estimated at $312,584, approximately $194 per square foot. 324 Emerald Ln is a home located in Kane County with nearby schools including Algonquin Lakes Elementary School, Algonquin Middle School, and Dundee-Crown High School.
Ownership History
Date
Name
Owned For
Owner Type
Purchase Details
Closed on
May 22, 2017
Sold by
Owen Maria
Bought by
Johnson Michael
Current Estimated Value
Home Financials for this Owner
Home Financials are based on the most recent Mortgage that was taken out on this home.
Original Mortgage
$164,957
Outstanding Balance
$137,743
Interest Rate
4.25%
Mortgage Type
FHA
Estimated Equity
$174,841
Purchase Details
Closed on
Dec 2, 2011
Sold by
Owen Michael J and Reczek Lauren M
Bought by
The Maria Owen Trust and Owen Maria
Purchase Details
Closed on
Apr 4, 2002
Sold by
Realen Homes Lp
Bought by
Owen Michael J and Reczek Lauren M
Home Financials for this Owner
Home Financials are based on the most recent Mortgage that was taken out on this home.
Original Mortgage
$184,950
Interest Rate
6.82%
Mortgage Type
FHA
Create a Home Valuation Report for This Property
The Home Valuation Report is an in-depth analysis detailing your home's value as well as a comparison with similar homes in the area
Home Values in the Area
Average Home Value in this Area
Purchase History
| Date | Buyer | Sale Price | Title Company |
|---|---|---|---|
| Johnson Michael | $168,000 | Heritage Title Co | |
| The Maria Owen Trust | $165,000 | Chicago Title Insurance Co | |
| Owen Michael J | $190,500 | Chicago Title Insurance Co |
Source: Public Records
Mortgage History
| Date | Status | Borrower | Loan Amount |
|---|---|---|---|
| Open | Johnson Michael | $164,957 | |
| Previous Owner | Owen Michael J | $184,950 |
Source: Public Records
Tax History Compared to Growth
Tax History
| Year | Tax Paid | Tax Assessment Tax Assessment Total Assessment is a certain percentage of the fair market value that is determined by local assessors to be the total taxable value of land and additions on the property. | Land | Improvement |
|---|---|---|---|---|
| 2024 | $5,590 | $81,529 | $8,371 | $73,158 |
| 2023 | $5,319 | $73,357 | $7,532 | $65,825 |
| 2022 | $5,199 | $68,206 | $7,532 | $60,674 |
| 2021 | $5,036 | $64,400 | $7,112 | $57,288 |
| 2020 | $4,934 | $62,952 | $6,952 | $56,000 |
| 2019 | $4,773 | $59,761 | $6,600 | $53,161 |
| 2018 | $4,778 | $57,819 | $6,469 | $51,350 |
| 2017 | $4,572 | $54,087 | $6,051 | $48,036 |
| 2016 | $4,682 | $52,369 | $5,859 | $46,510 |
| 2015 | -- | $49,071 | $5,490 | $43,581 |
| 2014 | -- | $42,729 | $5,338 | $37,391 |
| 2013 | -- | $44,037 | $5,501 | $38,536 |
Source: Public Records
Map
Nearby Homes
- 400 Diamond Back Way
- 460 Mahogany Dr
- 451 Mahogany Dr
- 2003 Magenta Ln
- 9999 Sandbloom Rd
- 2150 E Algonquin Rd
- 1114 Riverwood Dr Unit 1114
- 1551 Glacier Trail Unit 644
- 1943 Ozark Pkwy
- 1535 Teri Ln
- Lot 4 b Ryan Pkwy
- 1770 E Algonquin Rd
- 1782 Cumberland Pkwy
- 2 Cumberland Pkwy
- 69 Alice St
- 1659 E Algonquin Rd
- 2260 Indigo Dr
- 1670 Yosemite Pkwy
- 1715 Riverwood Dr
- 713 Silverstone Dr Unit 77
- 320 Emerald Ln Unit 12/4
- 326 Emerald Ln Unit 12/1
- 315 Lake Gillilan Way Unit 16/3
- 317 Lake Gillilan Way Unit 16/4
- 330 Emerald Ln Unit 114D
- 313 Lake Gillilan Way Unit 16/2
- 311 Lake Gillilan Way Unit 161
- 332 Emerald Ln Unit 11/3
- 334 Emerald Ln Unit 112
- 311 Lake Gillian Way
- 322 Emerald Ln Unit 123
- 323 Lake Gillilan Way Unit 17/2
- 300 Emerald Ln Unit 144
- 302 Emerald Ln Unit 302
- 310 Emerald Ln Unit 134
- 306 Emerald Ln Unit 141
- 316 Emerald Ln Unit 13/1
- 314 Emerald Ln Unit 2
- 304 Emerald Ln Unit 142C
- 312 Emerald Ln Unit 133