324 S 38th St Billings, MT 59101
South Side NeighborhoodEstimated Value: $219,000 - $263,658
About This Home
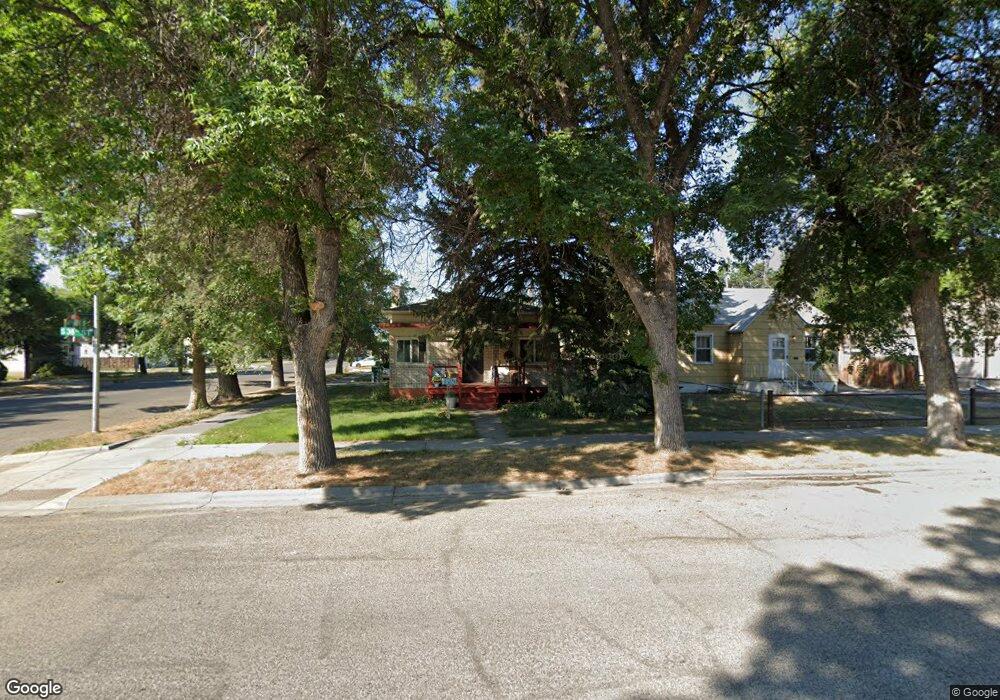
This home is located at 324 S 38th St, Billings, MT 59101 and is currently estimated at $244,553, approximately $315 per square foot. 324 S 38th St is a home located in Yellowstone County with nearby schools including Orchard School, Riverside Junior High School, and Billings Senior High School.
Ownership History
We collect this data history from publicly available records. To have your information removed, we recommend requesting removal directly through your county’s website.
Purchase Details
Home Financials for this Owner
Home Financials are based on the most recent Mortgage that was taken out on this home.Home Values in the Area
Average Home Value in this Area
Purchase History
We collect this data history from publicly available records. To have your information removed, we recommend requesting removal directly through your county’s website.
| Date | Buyer | Sale Price | Title Company |
|---|---|---|---|
| -- | Stewart Title Company |
Mortgage History
We collect this data history from publicly available records. To have your information removed, we recommend requesting removal directly through your county’s website.
| Date | Status | Borrower | Loan Amount |
|---|---|---|---|
| Open | $20,000 | ||
| Open | $174,250 |
Tax History
We collect this data history from publicly available records. To have your information removed, we recommend requesting removal directly through your county’s website.
| Year | Tax Paid | Tax Assessment Tax Assessment Total Assessment is a certain percentage of the fair market value that is determined by local assessors to be the total taxable value of land and additions on the property. | Land | Improvement |
|---|---|---|---|---|
| 2025 | $2,205 | $269,500 | $39,332 | $230,168 |
| 2024 | $2,205 | $215,900 | $38,678 | $177,222 |
| 2023 | $2,205 | $215,900 | $38,678 | $177,222 |
| 2022 | $1,656 | $175,400 | $0 | $0 |
| 2021 | $1,950 | $175,400 | $0 | $0 |
| 2020 | $1,882 | $156,400 | $0 | $0 |
| 2019 | $1,793 | $156,400 | $0 | $0 |
| 2018 | $1,708 | $145,600 | $0 | $0 |
| 2017 | $1,348 | $145,600 | $0 | $0 |
| 2016 | $1,589 | $140,100 | $0 | $0 |
| 2015 | $1,547 | $140,100 | $0 | $0 |
| 2014 | $1,353 | $63,971 | $0 | $0 |
Map
- 3714 5th Ave S
- 22 Jefferson St
- 27 Monroe St
- 4131 Buchanan Ave
- 4116 Buchanan Ave
- 45 Jackson St
- 3920 1st Ave S
- 3318 2nd Ave S
- 24 Broadwater Ave
- 506 S 32nd St
- 223 Monarch St
- 3212 6th Ave S
- 313 Viceroy St
- 240 Terry Ave
- 3421 Franklin Ln
- 329 Monroe St
- 420 S 30th St
- 4124 Vaughn Ln
- 309 S 30th St
- 105 Yellowstone Ave
Ask me questions while you tour the home.