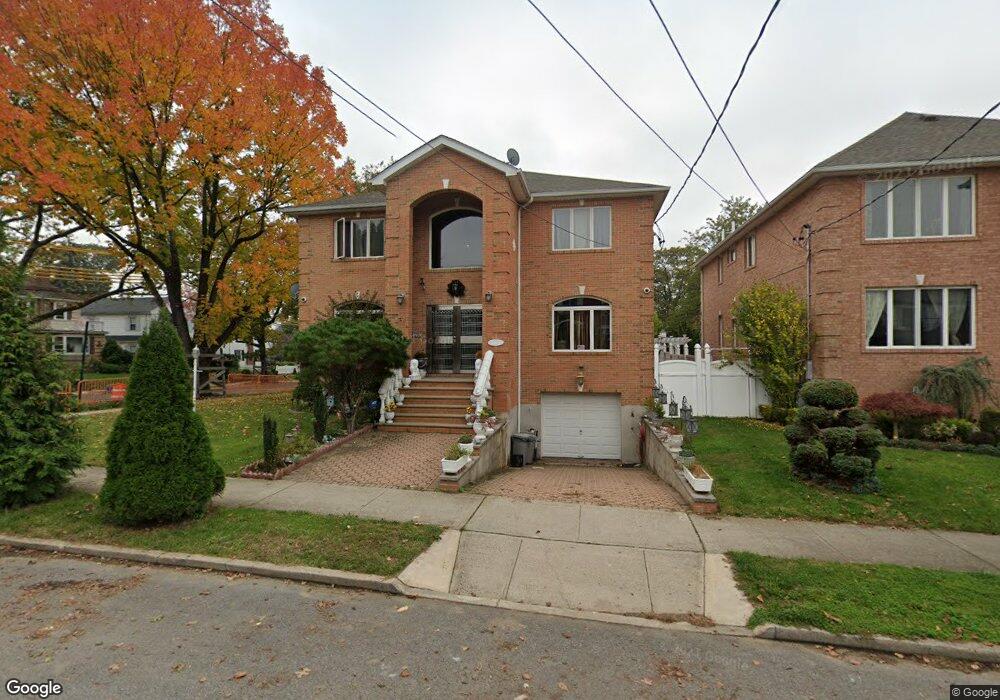
3240 168th St Flushing, NY 11358
Murray Hill-Broadway NeighborhoodEstimated Value: $1,227,000 - $1,782,000
Studio
--
Bath
2,475
Sq Ft
$616/Sq Ft
Est. Value
About This Home
This home is located at 3240 168th St, Flushing, NY 11358 and is currently estimated at $1,523,820, approximately $615 per square foot. 3240 168th St is a home located in Queens County with nearby schools including P.S. 32 - State Street, I.S. 25 Adrien Block, and Francis Lewis High School.
Ownership History
Date
Name
Owned For
Owner Type
Purchase Details
Closed on
Dec 1, 2006
Sold by
Minino Manuel
Bought by
Japra Gurpal and Saini Rupinder J
Current Estimated Value
Home Financials for this Owner
Home Financials are based on the most recent Mortgage that was taken out on this home.
Original Mortgage
$325,000
Outstanding Balance
$194,311
Interest Rate
6.31%
Mortgage Type
Purchase Money Mortgage
Estimated Equity
$1,329,509
Purchase Details
Closed on
Jul 21, 2005
Sold by
Benet Michael and Ge Cindy
Bought by
Minino Manuel
Purchase Details
Closed on
Dec 22, 2003
Sold by
Shen Amy H L and Shen Keh-Hsin
Bought by
Benet Michael and Ge Cindy
Purchase Details
Closed on
Jul 21, 1995
Sold by
Lee Bok Sun
Bought by
Shen Keh Hsin and Shen Amy H L
Home Financials for this Owner
Home Financials are based on the most recent Mortgage that was taken out on this home.
Original Mortgage
$111,338
Interest Rate
7.5%
Create a Home Valuation Report for This Property
The Home Valuation Report is an in-depth analysis detailing your home's value as well as a comparison with similar homes in the area
Home Values in the Area
Average Home Value in this Area
Purchase History
| Date | Buyer | Sale Price | Title Company |
|---|---|---|---|
| Japra Gurpal | $650,000 | -- | |
| Minino Manuel | $615,000 | -- | |
| Benet Michael | $920,000 | -- | |
| Shen Keh Hsin | $261,500 | First American Title Ins Co |
Source: Public Records
Mortgage History
| Date | Status | Borrower | Loan Amount |
|---|---|---|---|
| Open | Japra Gurpal | $325,000 | |
| Previous Owner | Shen Keh Hsin | $111,338 |
Source: Public Records
Tax History
| Year | Tax Paid | Tax Assessment Tax Assessment Total Assessment is a certain percentage of the fair market value that is determined by local assessors to be the total taxable value of land and additions on the property. | Land | Improvement |
|---|---|---|---|---|
| 2025 | $11,242 | $60,813 | $24,161 | $36,652 |
| 2024 | $11,254 | $57,371 | $24,808 | $32,563 |
| 2018 | $13,132 | $65,880 | $39,423 | $26,457 |
| 2017 | $13,130 | $65,880 | $35,015 | $30,865 |
| 2016 | $12,761 | $65,880 | $35,015 | $30,865 |
| 2015 | $7,948 | $61,685 | $44,061 | $17,624 |
| 2014 | $7,948 | $58,194 | $42,916 | $15,278 |
Source: Public Records
Map
Nearby Homes
- 3236 168th St
- 167-11 33rd Ave
- 16711 33rd Ave
- 3232 168th St
- 167 E 33rd St
- 167 E 33rd St Unit 3
- 167 E 33rd St Unit 5A
- 167 E 33rd St Unit 4-C
- 167 E 33rd St Unit 3-A
- 167 E 33rd St Unit 2-A
- 167 E 33rd St
- 167 E 33rd St Unit 4A
- 167 E 33rd St Unit 3C
- 167 E 33rd St Unit 3B
- 167 E 33rd St Unit 4B
- 3231 167th St
- 3237 168th St
- 16714 33rd Ave
- 3302 168th St
- 16714 33rd Ave
Your Personal Tour Guide
Ask me questions while you tour the home.