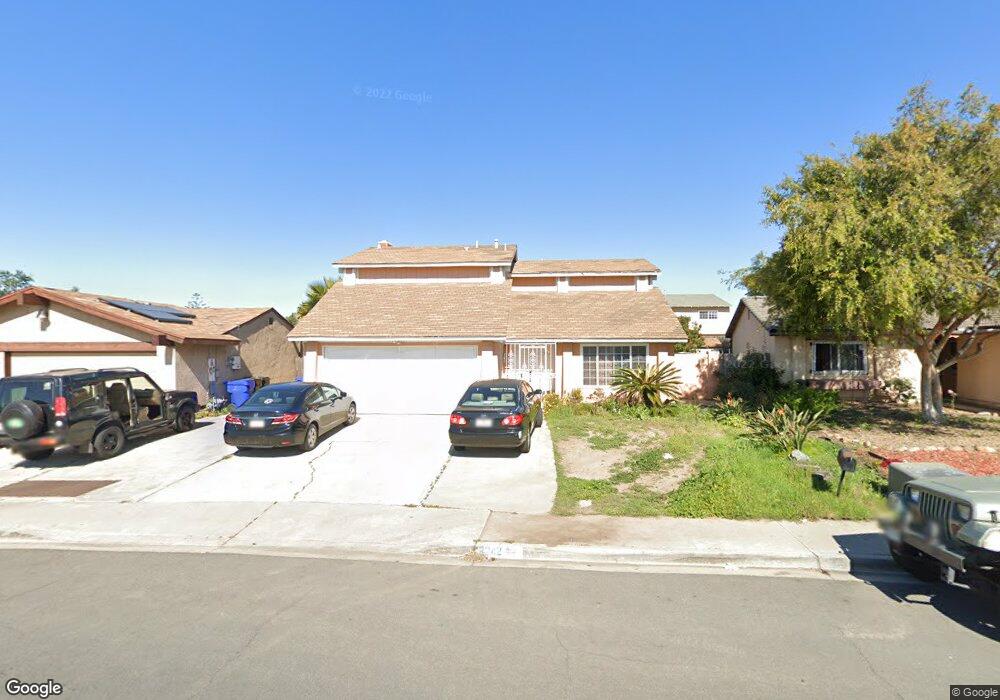
3242 Tequila Way San Ysidro, CA 92173
San Ysidro NeighborhoodEstimated Value: $718,000 - $826,000
4
Beds
3
Baths
1,745
Sq Ft
$442/Sq Ft
Est. Value
About This Home
This home is located at 3242 Tequila Way, San Ysidro, CA 92173 and is currently estimated at $770,572, approximately $441 per square foot. 3242 Tequila Way is a home located in San Diego County with nearby schools including Nicoloff Elementary School, Southwest Middle School, and Southwest Senior High School.
Ownership History
Date
Name
Owned For
Owner Type
Purchase Details
Closed on
Sep 19, 2008
Sold by
Bank Of New York
Bought by
Barrera Manuel G and Barrera Sandra Luz
Current Estimated Value
Home Financials for this Owner
Home Financials are based on the most recent Mortgage that was taken out on this home.
Original Mortgage
$306,347
Outstanding Balance
$196,305
Interest Rate
5.77%
Mortgage Type
VA
Estimated Equity
$574,267
Purchase Details
Closed on
Nov 30, 2007
Sold by
Moore Darryl D and Moore Victoria L
Bought by
Bank Of New York
Purchase Details
Closed on
May 13, 2005
Sold by
Lopez Guillermo and Lopez Carmen
Bought by
Moore Darryl D and Moore Victoria L
Home Financials for this Owner
Home Financials are based on the most recent Mortgage that was taken out on this home.
Original Mortgage
$424,000
Interest Rate
6.5%
Mortgage Type
Unknown
Purchase Details
Closed on
Mar 28, 1986
Create a Home Valuation Report for This Property
The Home Valuation Report is an in-depth analysis detailing your home's value as well as a comparison with similar homes in the area
Home Values in the Area
Average Home Value in this Area
Purchase History
| Date | Buyer | Sale Price | Title Company |
|---|---|---|---|
| Barrera Manuel G | $300,000 | First American Title Lenders | |
| Bank Of New York | $390,150 | Landsafe Title | |
| Moore Darryl D | $530,000 | Southland Title | |
| -- | $97,000 | -- |
Source: Public Records
Mortgage History
| Date | Status | Borrower | Loan Amount |
|---|---|---|---|
| Open | Barrera Manuel G | $306,347 | |
| Previous Owner | Moore Darryl D | $424,000 | |
| Closed | Moore Darryl D | $106,000 |
Source: Public Records
Tax History Compared to Growth
Tax History
| Year | Tax Paid | Tax Assessment Tax Assessment Total Assessment is a certain percentage of the fair market value that is determined by local assessors to be the total taxable value of land and additions on the property. | Land | Improvement |
|---|---|---|---|---|
| 2025 | $4,356 | $386,184 | $197,382 | $188,802 |
| 2024 | $4,356 | $378,612 | $193,512 | $185,100 |
| 2023 | $4,321 | $371,189 | $189,718 | $181,471 |
| 2022 | $4,238 | $363,912 | $185,999 | $177,913 |
| 2021 | $4,105 | $356,777 | $182,352 | $174,425 |
| 2020 | $4,008 | $353,120 | $180,483 | $172,637 |
| 2019 | $4,004 | $346,197 | $176,945 | $169,252 |
| 2018 | $3,935 | $339,410 | $173,476 | $165,934 |
| 2017 | $3,852 | $332,756 | $170,075 | $162,681 |
| 2016 | $3,719 | $326,233 | $166,741 | $159,492 |
| 2015 | $3,712 | $321,334 | $164,237 | $157,097 |
| 2014 | $3,649 | $315,040 | $161,020 | $154,020 |
Source: Public Records
Map
Nearby Homes
- 1847 Via Encantadoras
- 1756 Via Del Tanido
- 3053 Tequila Way
- 2033 Dairy Mart Rd Unit 13
- 879 W San Ysidro Blvd Unit 1
- 1697 Shooting Star Ct
- 875 W San Ysidro Blvd Unit 14
- 1756 Howard Ave
- 3754 Shooting Star Dr
- 3550 Sunset Ln Unit 13
- 3566 Sunset Ln Unit 71
- 3572 Sunset Ln Unit 81
- 3498 Agosto St
- 1312 W San Ysidro Blvd Unit B
- 1564 Smythe Ave
- 1322 Carnell Ct
- 1323 Cornet Place
- 2950 Arbodar Rd
- 3801 Via de la Bandola
- 3833 Via Del Bardo
- 3232 Tequila Way
- 3252 Tequila Way
- 1710 Via Encantadoras
- 1716 Via Encantadoras
- 1704 Via Encantadoras
- 3262 Tequila Way
- 1722 Via Encantadoras
- 3263 Tequila Way
- 3253 Tequila Way
- 1728 Via Encantadoras
- 3272 Tequila Way
- 3243 Tequila Way
- 3273 Tequila Way
- 1734 Via Encantadoras
- 3233 Tequila Way
- 1744 Boca Del Tule
- 1732 Boca Del Tule
- 3282 Tequila Way
- 3283 Tequila Way
- 1740 Via Encantadoras